
Technical Indicator APIs for AI Agents
A practical guide to technical indicator APIs for AI agents — covering RSI, MACD, SMA, EMA, Bollinger Bands, ATR, volatility, momentum signals, market monitoring, and unified capability routing with QVeris.
What Is a Technical Indicator API?
A technical indicator API provides programmatic access to calculated market signals derived from price, volume, and volatility data — including RSI, MACD, simple and exponential moving averages, Bollinger Bands, ATR, VWAP, and momentum oscillators. For AI agents, these APIs transform raw OHLCV bars into structured, interpretable signals that can trigger reasoning, generate alerts, and feed research workflows.
Human traders manually inspect charts with indicator overlays. AI agents need structured indicator values with precise timestamps, lookback window definitions, and source data provenance — so they can reason over signals, compare timeframes, detect divergences, and generate research outputs without manually computing every indicator from raw price data.
The key differentiators for AI agent use cases are indicator breadth (how many indicators a provider calculates server-side), formula transparency (can the agent inspect how RSI or MACD is computed?), timeframe flexibility (daily, hourly, minute-level), and source data quality (adjusted vs unadjusted prices, corporate action handling). An indicator is only as reliable as the data and formula behind it.
Why AI Agents Need Technical Indicators
A stock quote API tells an agent the price. A technical indicator API helps the agent understand whether the move is extended, whether momentum is improving, whether volatility is rising, and whether the price is crossing a relevant moving average. Here are five reasons indicator data is essential:
1. Raw Prices Need Signal Context
A price of $150 means nothing in isolation. RSI at 78 tells the agent the stock may be overextended. MACD crossing above its signal line indicates improving momentum. Moving averages provide trend context that raw prices cannot.
2. Trend Agents Need Moving Averages
SMA and EMA crossovers are among the most widely referenced technical signals. An agent monitoring 50-day/200-day MA relationships can detect trend shifts across an entire watchlist programmatically.
3. Momentum Agents Need RSI and MACD
Momentum indicators measure the rate of price change. RSI quantifies overbought/oversold conditions. MACD identifies trend direction and momentum shifts. These are foundational inputs for signal-aware research agents.
4. Risk Agents Need Volatility Indicators
Bollinger Bands show price relative to volatility envelopes. ATR quantifies average daily range. These indicators help risk agents size position context and detect volatility regime changes — without manual calculation.
5. Alert Agents Need Structured Threshold Conditions
An alert agent that watches for "RSI above 70" or "price crossing below 200-day MA" needs structured indicator values with precise timestamps — not a chart screenshot. Indicator APIs provide exactly this.
Common Technical Indicators for AI Agents
| Indicator | What It Measures | Why It Matters for AI Agents |
|---|---|---|
| RSI | Momentum and overbought/oversold conditions (0–100) | Helps agents detect stretched price moves and potential reversals |
| MACD | Trend direction and momentum shifts | Helps agents summarize directional changes and signal crossovers |
| SMA / EMA | Average price over a lookback window | Provides trend context — 50-day and 200-day MAs are widely referenced benchmarks |
| Bollinger Bands | Price relative to volatility envelopes (±2σ) | Useful for volatility context, range detection, and squeeze identification |
| ATR | Average true range — volatility measure | Helps agents size risk context and detect volatility regime changes |
| VWAP | Volume-weighted average price (intraday) | Institutional benchmark for execution quality and intraday trend context |
| Volume Indicators | Trading activity and move confirmation | Confirms or questions price moves — volume surge on breakout increases signal confidence |
| Momentum Oscillators | Rate of price change | Helps agents detect acceleration, deceleration, and divergence patterns |
Important: No indicator guarantees future returns. AI agents should use indicators as research signals and monitoring context — not as standalone predictions or trading recommendations. Indicators describe market conditions; they do not prescribe actions.
Technical Indicator API Data Fields Agents Should Inspect
| Field | Why It Matters for AI Agents |
|---|---|
| Symbol | Maps the indicator value to the correct asset — essential for multi-symbol monitoring |
| Indicator Name | Identifies which signal this is — RSI, MACD, SMA, Bollinger Bands, ATR, etc. |
| Timeframe | Daily, hourly, minute-level, weekly — must match the agent's monitoring horizon |
| Lookback Period | Defines the calculation window — RSI(14) vs RSI(7) produce different signals |
| Source OHLCV Data | Adjusted vs unadjusted prices affect indicator accuracy — agents must verify |
| Value | The core indicator output — the number your agent evaluates against thresholds |
| Signal Line | Needed for MACD-style indicators — crossover detection between MACD and signal line |
| Timestamp | Critical for event ordering, timeframe alignment, and signal freshness validation |
| Adjustment Policy | Split/dividend adjustments change indicator values — agents must know the policy |
| Provider Formula Notes | RSI, MACD, and volatility calculations may differ across providers — inspect before relying |
Agents should inspect indicator formulas before using them. RSI calculated with Wilder's smoothing vs SMA smoothing produces different values. MACD using 12/26/9 defaults vs custom parameters changes signal timing. Provider-calculated indicators are convenient, but formula transparency is essential for production agent workflows.
Technical Indicator API Use Cases for AI Agents
1. Market Monitoring Agent
Required: technical_indicators, market_live_price, alert_delivery
Output: market signal alert with indicator context
QVeris Support: discover indicator capabilities → inspect formula notes and schema → call → validate timestamps → trigger structured alert.
2. Stock Research Agent
Required: historical_prices, technical_indicators, financial_news
Output: research brief with indicator-backed context
QVeris Support: discover price + indicator capabilities → inspect timeframe options → call → combine with news data → generate research brief.
3. Portfolio Risk Agent
Required: volatility_indicators, drawdown_metrics, portfolio_data
Output: risk summary with volatility and drawdown analysis
QVeris Support: discover volatility and risk capabilities → inspect calculation methodology → call → validate output → generate risk report.
4. Momentum Signal Agent
Required: RSI, MACD, moving_average
Output: momentum brief with signal cross-reference
QVeris Support: discover RSI/MACD/MA capabilities → inspect lookback and formula parameters → call → cross-reference signals → generate momentum report.
5. Earnings Reaction Agent
Required: price_history, volume_indicators, technical_indicators
Output: event reaction summary with pre/post indicator comparison
QVeris Support: discover price + volume + indicator capabilities → inspect event-window parameters → call → compare pre/post → generate reaction summary.
6. Multi-Timeframe Analysis Agent
Required: daily_indicators, intraday_indicators, historical_prices
Output: multi-timeframe report with alignment analysis
QVeris Support: discover multi-timeframe capabilities → inspect daily + intraday schema → call → align signals across timeframes → generate report.
QVeris Support means this workflow can be structured around capabilities discoverable through QVeris. QVeris is a capability routing layer — not the original source of every technical indicator or market data feed. Confirm exact capability availability, schemas, pricing, latency, and provider notes during Inspect before production use.
Technical Indicator API Provider Comparison for AI Agents
Provider coverage, free tiers, formulas, rate limits, and commercial terms change frequently. Verify official documentation before production deployment.
| Provider | Indicator Support | Asset Coverage | Free Access | Timeframes | Best For | AI Agent Fit |
|---|---|---|---|---|---|---|
| Alpha Vantage | 50+ built-in indicators | Stocks, FX, crypto | Limited free (25/day) | Daily, intraday | Learning, simple agents | Medium — good indicator breadth but low rate limit |
| Twelve Data | 130+ indicators, multi-asset | Stocks, ETFs, forex, crypto | Limited free (800/day) | Multi-timeframe | Multi-asset agents | High — broadest free indicator coverage |
| Finnhub | Aggregate signals, plan-dependent | Stocks, forex, crypto | Limited free (300/day) | Plan-dependent | Multi-signal agents | Medium — good for price + news + indicator combos |
| Polygon.io | OHLCV foundation; indicators may require computation | Stocks, options, forex, crypto | Paid-focused | Full tick, intraday, daily | Production market data | High — best raw data for custom indicator calculation |
| TAAPI.io | Technical analysis indicators | Crypto, market indicators | Limited / plan-dependent | Multi-timeframe | Indicator-heavy workflows | Medium — specialized indicator API, verify coverage |
| Custom (from OHLCV) | User-controlled formulas | Depends on data source | Depends on source | Flexible | Full control agents | High if validated — maximum transparency, requires computation |
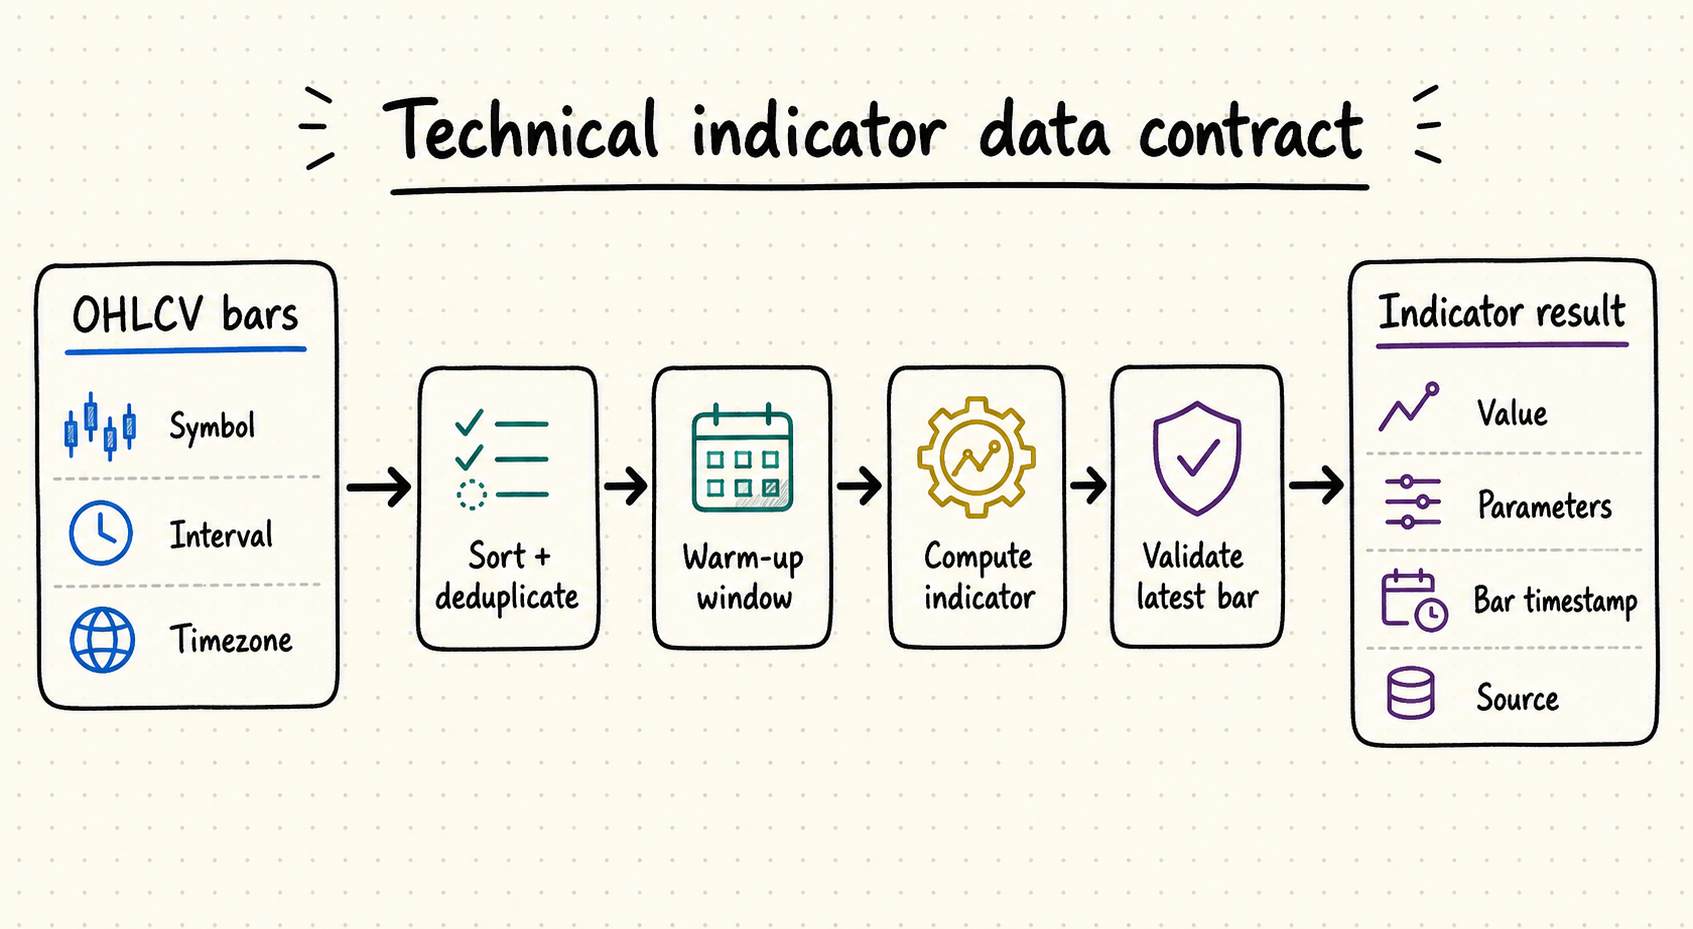
Indicator-Aware Agent Architecture
1. Define the Market Question
What is the agent trying to understand? Overbought conditions? Trend direction? Volatility regime? The question determines which indicators are relevant.
2. Select Indicators & Timeframes
Choose RSI for momentum, MACD for trend shifts, SMA/EMA for direction, Bollinger Bands for volatility — with daily or intraday timeframes as needed.
3. Discover Indicator Capabilities
Use QVeris Discover to find technical indicator, OHLCV, or analysis capabilities matching the required indicators and asset coverage.
4. Inspect Schema & Formulas
Before calling, inspect the indicator formula, lookback period, source data policy (adjusted vs unadjusted), cost, and output schema.
5. Call & Validate
Execute the capability. Validate timestamps, indicator values against known ranges, and cross-reference with source OHLCV if available.
6. Generate Output
Produce a research brief, alert, momentum report, or risk summary — with indicator values, source timestamps, and clear separation of signal vs interpretation.
Common Technical Indicator API Challenges for AI Agents
RSI using Wilder's smoothing ≠ RSI using SMA. MACD with 12/26/9 ≠ MACD with different parameters. Inspect formula definitions before relying on values.
Split-adjusted prices produce different indicator values than raw prices. An agent computing RSI on unadjusted data may get misleading signals after corporate actions.
Gaps in source price data propagate to indicator calculations. Agents should check for missing dates and handle NaN indicator values gracefully.
A "daily" close timestamp may differ across providers — UTC, EST, or exchange-local. Multi-provider agents must normalize timestamps before comparing indicator values.
An agent expecting hourly RSI but receiving daily RSI will produce incorrect analysis. Always verify the timeframe field in the provider response.
Computing RSI + MACD + SMA for 50 symbols may exceed free-tier rate limits. Plan API call budgets before deploying multi-symbol indicator agents.
Free-tier indicator data is often 15-minute delayed. Real-time indicator signals typically require paid plans. Verify latency before building alert agents.
All indicators are derived from past prices — they lag the market by design. Agents should not treat indicator values as predictive signals; they are descriptive context.
Combining many indicators does not improve signal quality. Agents should use indicators as structured context for research — not as an optimization target for backtesting.
An indicator value without a source timestamp, provider, and formula reference is not auditable. Production agents should preserve full metadata in all outputs.
Unified Technical Indicator Workflows with QVeris
Every technical indicator provider is different: different endpoint names, different formula implementations, different schemas, different rate limits, different adjustment policies. An agent that hardcodes indicator computation per provider accumulates technical debt — and risks generating inconsistent signals when switching between providers.
QVeris addresses this through a Discover → Inspect → Call → Validate → Report workflow. Your agent describes what indicator data it needs. QVeris discovers matching capabilities across providers, lets the agent inspect formulas and schemas before calling, and routes through a unified interface — with consistent field names and source traceability built in.
QVeris Support does not mean QVeris is the original source of every technical indicator or market data feed. It means an AI agent can use QVeris to discover, inspect, and call relevant technical indicator, historical price, market data, and analysis capabilities through a unified routing layer — with formula inspection, cost visibility, and provider-agnostic response handling. Read the docs → or view pricing →.
Getting Started Checklist
QVeris is a capability routing layer. Indicator data comes from third-party providers. Indicators describe market conditions — they do not guarantee future returns.
Add Market Signal Context to Your AI Agent
QVeris connects your agent to technical indicator, market data, and analysis capabilities across providers. Discover and Inspect are free forever. One unified protocol for signal-aware research and monitoring workflows.
Test an Indicator Workflow测试技术指标工作流Read the REST API Reference阅读 REST API 参考Historical Stock Price API for AI Agents →
OHLCV data, backtesting, and trend analysis — the foundation for indicator computation.
Real-Time Stock Price API for AI Agents →
Streaming prices for real-time indicator updates and alert workflows.
WebSocket Stock API for AI Agents →
Real-time streaming architecture for event-driven indicator monitoring.
Market Data API for AI Agents →
Complete comparison of market data providers across multiple asset classes.
Technical Indicator API FAQ
What is a technical indicator API?
Which indicators matter most for AI agents?
Can technical indicators predict stock prices?
Should agents use provider-calculated indicators or compute from OHLCV?
Do free APIs provide technical indicators?
How does QVeris help with technical indicator APIs?
Is this investment advice?
References & Sources
- Alpha Vantage Technical Indicators Documentation — alphavantage.co/documentation
- Twelve Data Technical Indicators Documentation — twelvedata.com/docs
- Finnhub Documentation — finnhub.io/docs
- Polygon.io Documentation — polygon.io/docs
- TAAPI.io Documentation — taapi.io
- QVeris Docs — qveris.ai/docs
- QVeris Pricing — qveris.ai/pricing
- QVeris Guide — Real-Time Stock Price API for AI Agents
- QVeris Guide — Stock API Free Comparison
- QVeris Guide — Historical Stock Price API for AI Agents
面向 AI Agent 的技术指标 API
面向 AI Agent 的技术指标 API 实用指南 — 涵盖 RSI、MACD、SMA、EMA、布林带、ATR、波动率、动量信号、市场监控以及通过 QVeris 的统一能力路由。
什么是技术指标 API?
技术指标 API 提供对从价格、成交量和波动率数据派生的计算市场信号的程序化访问 — 包括 RSI、MACD、简单和指数移动平均线、布林带、ATR、VWAP 和动量振荡器。对于 AI Agent,这些 API 将原始 OHLCV 柱状图转换为结构化、可解释的信号,可以触发推理、生成警报并驱动研究工作流。
人类交易者手动检查带有指标叠加的图表。AI Agent 需要结构化指标值,带有精确的时间戳、回溯窗口定义和源数据来源 — 以便对信号进行推理、比较时间框架、检测背离,并生成研究输出,而无需从原始价格数据手动计算每个指标。
对 AI Agent 场景至关重要的区别因素是指标广度(提供商服务端计算多少个指标)、公式透明度(Agent 能否检查 RSI 或 MACD 的计算方式?)、时间框架灵活性(日线、小时线、分钟级别)和源数据质量(调整后 vs 未调整价格、公司事件处理)。一个指标的可信度仅取决于其背后的数据和公式。
为什么 AI Agent 需要技术指标
股票报价 API 告诉 Agent 价格。技术指标 API 帮助 Agent 理解波动是否过度延伸、动量是否改善、波动率是否上升、以及价格是否突破相关移动平均线。以下是指标数据不可或缺的五个原因:
1. 原始价格需要信号上下文
孤立来看,150 美元的价格几乎没有解释力;RSI 为 78 则提示 Agent 股价可能已经过度延伸,MACD 向上穿越信号线表示动能正在改善,而移动平均线能补充原始价格无法提供的趋势背景。
2. 趋势 Agent 需要移动平均线
SMA 与 EMA 交叉是最常用的技术信号之一。Agent 持续监测 50 日与 200 日均线关系,便能以程序化方式识别整个自选列表中的趋势变化。
3. 动量 Agent 需要 RSI 和 MACD
动量指标衡量价格变化速度:RSI 用于量化超买与超卖状态,MACD 用于识别趋势方向和动能变化。这些都是信号感知型研究 Agent 的基础输入。
4. 风险 Agent 需要波动率指标
布林带展示价格相对于波动区间的位置,ATR 则量化平均真实波幅。这些指标可帮助风险 Agent 理解仓位环境并识别波动率状态变化,无需人工计算。
5. 预警 Agent 需要结构化阈值条件
监测“RSI 高于 70”或“价格跌破 200 日均线”的预警 Agent,需要带精确时间戳的结构化指标值,而不是一张图表截图;技术指标 API 正好提供这种数据。
AI Agent 常用的技术指标
| 指标 | 衡量内容 | 为什么对 AI Agent 重要 |
|---|---|---|
| RSI | 衡量动量以及超买、超卖状态(0–100) | 帮助 Agent 识别价格过度延伸与潜在反转 |
| MACD | 识别趋势方向与动能变化 | 帮助 Agent 总结方向变化与信号交叉 |
| SMA / EMA | 计算回看窗口内的平均价格 | 提供趋势背景;50 日和 200 日均线是广泛使用的参考基准 |
| 布林带 | 价格相对于波动区间的位置(±2σ) | 用于理解波动环境、识别交易区间和波动收窄 |
| ATR | 平均真实波幅,用于衡量波动率 | 帮助 Agent 评估风险环境并识别波动率状态变化 |
| VWAP | 成交量加权平均价(日内) | 评估执行质量与日内趋势的机构常用基准 |
| 成交量指标 | 衡量交易活跃度并确认价格变动 | 用于确认或质疑价格变动;突破时放量通常会提高信号可信度 |
| 动量振荡指标 | 价格变化率 | 帮助 Agent 识别加速、减速与背离形态 |
重要:没有任何指标能保证未来收益。AI Agent 应将指标用作研究信号和监控上下文 — 而非独立预测或交易建议。指标描述市场状况;它们不规定行动。
AI Agent 应检查的技术指标 API 数据字段
| 字段 | 为什么对 AI Agent 重要 |
|---|---|
| 标的代码 | 把指标值对应到正确资产,是多标的监控的基础。 |
| 指标名称 | 标明信号类型,例如 RSI、MACD、SMA、布林带或 ATR。 |
| 时间周期 | 日线、小时线、分钟线或周线必须与 Agent 的监控周期一致。 |
| 回看周期 | 定义计算窗口;RSI(14) 与 RSI(7) 会产生不同信号。 |
| 源 OHLCV 数据 | 复权与未复权价格会影响指标准确性,Agent 必须核实。 |
| 指标值 | 指标的核心输出,Agent 会用它与阈值进行比较。 |
| 信号线 | MACD 等指标需要信号线来判断交叉。 |
| 时间戳 | 用于事件排序、周期对齐和信号新鲜度校验。 |
| 复权策略 | 拆股和分红调整会改变指标值,Agent 必须了解数据政策。 |
| 提供商公式说明 | 不同提供商的 RSI、MACD 和波动率计算可能不同,使用前应先检查公式。 |
Agent 应在使用前检查指标公式。使用 Wilder 平滑 vs SMA 平滑计算的 RSI 会产生不同的值。MACD 使用 12/26/9 默认参数 vs 自定义参数会改变信号时序。提供商计算的指标很方便,但公式透明度对生产 Agent 工作流至关重要。
面向 AI Agent 的技术指标 API 应用场景
1. 市场监控 Agent
所需能力: technical_indicators, market_live_price, alert_delivery
输出: market signal alert with indicator context
QVeris 支持: discover indicator capabilities → inspect formula notes and schema → call → validate timestamps → trigger structured alert.
2. 股票研究 Agent
所需能力: historical_prices, technical_indicators, financial_news
输出: research brief with indicator-backed context
QVeris 支持: discover price + indicator capabilities → inspect timeframe options → call → combine with news data → generate research brief.
3. 投资组合风险 Agent
所需能力: volatility_indicators, drawdown_metrics, portfolio_data
输出: risk summary with volatility and drawdown analysis
QVeris 支持: discover volatility and risk capabilities → inspect calculation methodology → call → validate output → generate risk report.
4. 动量信号 Agent
所需能力: RSI, MACD, moving_average
输出: momentum brief with signal cross-reference
QVeris 支持: discover RSI/MACD/MA capabilities → inspect lookback and formula parameters → call → cross-reference signals → generate momentum report.
5. 财报反应 Agent
所需能力: price_history, volume_indicators, technical_indicators
输出: event reaction summary with pre/post indicator comparison
QVeris 支持: discover price + volume + indicator capabilities → inspect event-window parameters → call → compare pre/post → generate reaction summary.
6. 多周期分析 Agent
所需能力: daily_indicators, intraday_indicators, historical_prices
输出: multi-timeframe report with alignment analysis
QVeris 支持: discover multi-timeframe capabilities → inspect daily + intraday schema → call → align signals across timeframes → generate report.
QVeris Support 意味着此工作流可以围绕通过 QVeris 可发现的能力构建。QVeris 是能力路由层 — 而非每个技术指标或市场数据源的原始来源。生产使用前请在 Inspect 期间确认确切的能力可用性、Schema、定价、延迟和提供商说明。
面向 AI Agent 的技术指标 API 提供商对比
提供商覆盖范围、免费套餐、公式、速率限制和商业条款经常变化。生产部署前请验证官方文档。
| 提供商 | 指标支持 | 资产覆盖 | 免费接入 | 时间周期 | 最适合 | AI Agent 适配度 |
|---|---|---|---|---|---|---|
| Alpha Vantage | 内置 50 多种指标 | 股票、外汇、加密货币 | 免费额度有限(25 次/日) | 日线、日内 | 学习与轻量 Agent | 中等:指标覆盖较广,但速率限制较低 |
| Twelve Data | 130 多种指标,覆盖多资产 | 股票、ETF、外汇、加密货币 | 免费额度有限(800 次/日) | 多时间周期 | 多资产 Agent | 高:免费层指标覆盖最广 |
| Finnhub | 聚合信号,具体取决于套餐 | Stocks, forex, crypto | 免费额度有限(300 次/日) | 取决于套餐 | 多信号 Agent | 中等:适合组合价格、新闻与指标信号 |
| Polygon.io | 提供 OHLCV 基础数据,指标可能需要自行计算 | 股票、期权、外汇、加密货币 | 以付费方案为主 | 逐笔、日内、日线 | 生产级市场数据 | 高:适合基于原始数据自定义计算指标 |
| TAAPI.io | 技术分析指标 | 加密货币与市场指标 | 额度有限,取决于套餐 | 多时间周期 | 指标密集型工作流 | 中等:专用指标 API,需核实覆盖范围 |
| 自定义(基于 OHLCV) | 用户自行控制公式 | 取决于数据源 | 取决于数据源 | 灵活 | 需要完全控制的 Agent | 验证充分时为高:透明度最高,但需要自行计算 |
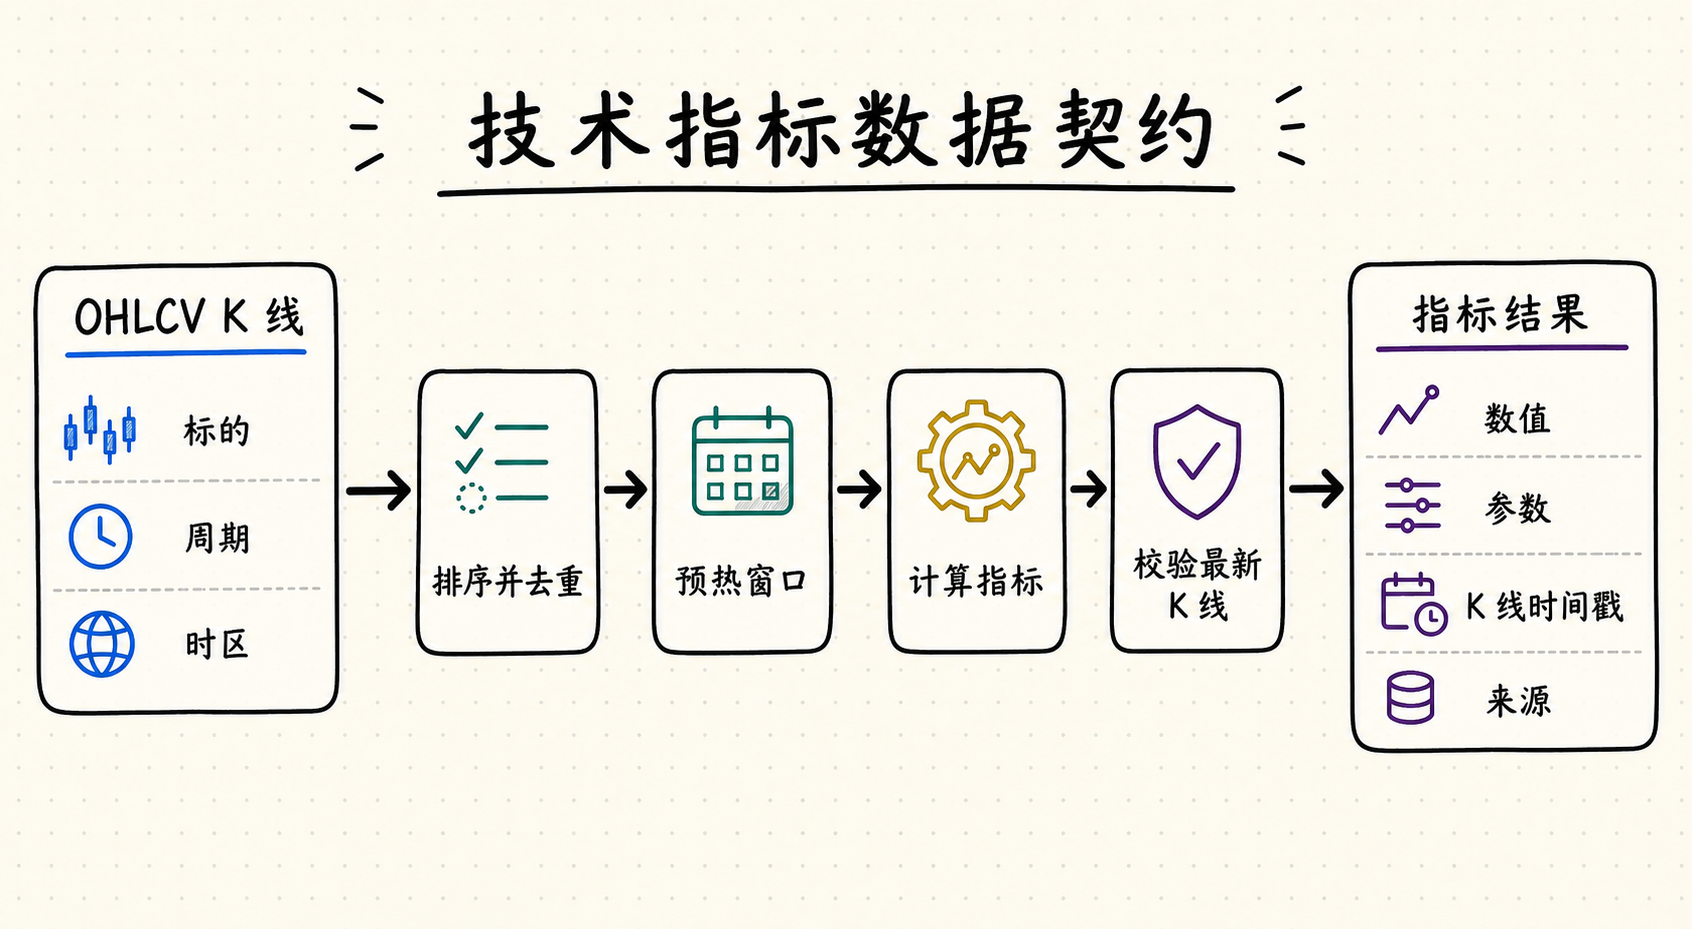
指标感知的 Agent 架构
1. 定义市场问题
先明确 Agent 想理解什么:超买状态、趋势方向,还是波动率环境。问题本身决定哪些指标最相关。
2. 选择指标与时间周期
动量可选 RSI,趋势变化可选 MACD,方向可选 SMA/EMA,波动率可选布林带,并根据需求选择日线或日内周期。
3. 发现指标能力
使用 QVeris Discover 查找符合所需指标与资产覆盖范围的技术指标、OHLCV 或分析能力。
4. 检查 Schema 与公式
调用前检查指标公式、回看周期、源数据复权政策、成本和输出 Schema。
5. 调用 & 验证
执行能力后,验证时间戳和指标值是否处于合理范围;如条件允许,再与源 OHLCV 数据交叉核对。
6. 生成输出
生成研究简报、预警、动量报告或风险摘要,并附上指标值和来源时间戳,清楚区分信号本身与模型解读。
AI Agent 常见的技术指标 API 挑战
使用 Wilder 平滑的 RSI ≠ 使用 SMA 的 RSI。MACD 12/26/9 ≠ 不同参数的 MACD。在依赖数值之前检查公式定义。
拆股调整后的价格产生的指标值与原始价格不同。Agent 在公司事件后基于未调整数据计算 RSI 可能得到误导性信号。
源价格数据中的缺口会传播到指标计算。Agent 应检查缺失日期并优雅处理 NaN 指标值。
「日线」收盘时间戳在不同提供商之间可能不同 — UTC、EST 或交易所本地时间。多提供商 Agent 在比较指标值之前必须标准化时间戳。
期望收到小时 RSI 但收到日线 RSI 的 Agent 会产生错误分析。务必验证提供商响应中的时间框架字段。
为 50 个标的计算 RSI + MACD + SMA 可能超出免费套餐速率限制。在部署多标的指标 Agent 之前规划 API 调用预算。
免费套餐的指标数据通常是 15 分钟延迟的。实时指标信号通常需要付费计划。在构建警报 Agent 之前验证延迟。
所有指标都从过去的价格派生 — 它们本质上滞后于市场。Agent 不应将指标值视为预测信号;它们是描述性上下文。
组合许多指标不会提高信号质量。Agent 应将指标用作研究的结构化上下文 — 而非回测的优化目标。
没有来源时间戳、提供商和公式参考的指标值无法审计。生产 Agent 应在所有输出中保留完整的元数据。
使用 QVeris 统一技术指标工作流
每个技术指标提供商都不同:不同的端点名称、不同的公式实现、不同的 Schema、不同的速率限制、不同的调整政策。为每个提供商硬编码指标计算的 Agent 会累积技术债务 — 并且在提供商之间切换时可能生成不一致的信号。
QVeris 通过 发现 → 检查 → 调用 → 验证 → 报告 工作流解决这一问题。您的 Agent 描述它需要什么指标数据。QVeris 发现跨提供商匹配的能力、让 Agent 在调用前检查公式和 Schema、并通过统一接口路由 — 内置一致的字段名称和来源可追溯性。
QVeris Support 并不意味着 QVeris 是每个技术指标或市场数据源的原始来源。它意味着 AI Agent 可以使用 QVeris 通过统一路由层发现、检查和调用相关技术指标、历史价格、市场数据和分析能力 — 内置公式检查、成本可见性和提供商无关的响应处理。阅读文档 → 或 查看定价 →。
快速上手指南
QVeris 是能力路由层。指标数据来自第三方提供商。指标描述市场状况 — 不保证未来收益。
为您的 AI Agent 添加市场信号上下文
QVeris 将您的 Agent 连接到跨提供商的技术指标、市场数据和分析能力。Discover 和 Inspect 永久免费。一个统一协议,用于信号感知的研究和监控工作流。
Test an Indicator 工作流测试技术指标工作流Read the REST API Reference阅读 REST API 参考面向 AI Agent 的历史股票价格 API →
OHLCV 数据、回测与趋势分析,是计算技术指标的基础。
面向 AI Agent 的实时股票价格 API →
用于实时更新指标和触发预警工作流的流式价格数据。
面向 AI Agent 的 WebSocket 股票 API →
用于事件驱动指标监控的实时流式架构。
面向 AI Agent 的市场数据 API →
跨多个资产类别对市场数据提供商进行完整比较。
技术指标 API 常见问题
什么是技术指标 API?
哪些指标对 AI Agent 最重要?
技术指标能预测股价吗?
Agent 应使用供应商计算的指标,还是基于 OHLCV 自行计算?
免费 API 提供技术指标吗?
QVeris 如何帮助接入技术指标 API?
这是投资建议吗?
参考资料与来源
- Alpha Vantage 技术指标文档 — alphavantage.co/documentation
- Twelve Data 技术指标文档 — twelvedata.com/docs
- Finnhub 文档 — finnhub.io/docs
- Polygon.io 文档 — polygon.io/docs
- TAAPI.io 文档 — taapi.io
- QVeris 文档 — qveris.ai/docs
- QVeris 定价 — qveris.ai/pricing
- QVeris 指南 — 面向 AI Agent 的实时股票价格 API
- QVeris 指南 — 免费股票 API 对比
- QVeris 指南 — 面向 AI Agent 的历史股票价格 API