
Free Technical Analysis API
for Indicators and SignalsTechnical Analysis API
Indicators & Signals
Compare markets, indicators, intervals, limits, and validation before connecting analysis to an app or agent.
TL;DR
A free technical analysis API that returns usable indicator values without requiring local calculations from raw OHLCV bars.
Indicators, supported markets, intervals, history, free-plan limits, latency, licensing, and response fields.
Timestamped RSI, MACD, SMA, EMA, Bollinger Bands, ATR, ADX, stochastic, and related values.
QVeris helps agents discover technical-analysis capabilities, inspect their contracts, and call a selected tool.
What a free technical analysis API returns
A technical indicator API usually accepts a symbol, market or exchange, interval, indicator name, and calculation parameters. It returns one or more timestamped values derived from price and volume bars. A useful response also reveals parameter settings, ordering, null warm-up rows, and the underlying bar time.
Technical indicators API
Look for RSI, MACD, moving averages, Bollinger Bands, ATR, ADX, stochastic oscillators, and any indicator-specific parameters your application needs.
Market and interval coverage
Confirm stocks, crypto, forex, ETFs, or indices separately. Check supported exchanges and whether daily, intraday, or real-time intervals require a paid entitlement.
Response schema and freshness
Inspect timestamps, timezone, numeric types, ascending or descending order, adjustment rules, and the documented data delay.
Free plan constraints
Check requests per minute and day, endpoint credits, historical depth, commercial-use rights, attribution, and whether indicator endpoints are included.
Snapshot, series, or interpreted signal
A latest-value endpoint answers a different question from a complete historical series. Some services also return labels such as overbought, crossover, or buy and sell. Treat those labels as provider interpretations: require the rule, threshold, confirmation window, and model version instead of assuming they are equivalent to raw indicators.
Formula and source-bar identity
Record smoothing method, initialization, price input, lookback, deviation convention, precision, and methodology version. Tie every result to the underlying bar provider, venue or exchange, session, timezone, interval boundary, candle status, and corporate-action adjustment so differences can be explained.
Pre-calculated API versus local library
Use an API when a few consistent indicators and low integration effort matter most. Prefer local calculation when you already have licensed OHLCV data, need many parameter combinations, want version-controlled formulas, or must reproduce historical values exactly. Include bar-access cost and request credits in the comparison.
Free technical analysis APIs worth testing
There is no single provider that is automatically best for every indicator workflow. The practical shortlist depends on whether you want a broad catalog of pre-calculated indicators, a simple endpoint for one chart, or control over the source candles and formula. The candidates below publish technical-indicator documentation and offer a way to evaluate the service, but endpoint access, market-data entitlements, quotas, and commercial terms can change. Confirm the current plan page before building around any free allowance.
| Provider | Good starting point | What to verify | Best fit |
|---|---|---|---|
| Alpha Vantage | Named functions for RSI, MACD, SMA, EMA, BBANDS, ATR, ADX and other indicators, with explicit interval and parameter inputs. | Whether the chosen function, interval, output size, asset, and underlying market data are available under the current key and plan. | Learning, notebooks, scheduled analysis, and applications that prefer one documented function per indicator. |
| Twelve Data | Indicator endpoints such as RSI, MACD and Bollinger Bands alongside time-series market data, with a consistent REST-style request model. | Symbol and exchange resolution, interval availability, endpoint credit weight, history depth, and whether the returned candle is complete. | Multi-asset prototypes that want market data and indicators through one API family. |
| TAAPI.IO | A technical-analysis-focused API with individual and bulk indicator requests, useful when an application needs many indicator types without maintaining a calculation library. | Supported exchanges and assets, candle source, backtrack behavior, bulk-request accounting, data delay, and plan-specific limits. | Indicator-heavy alerts and dashboards where calculation convenience matters more than owning the formula implementation. |
| Local library + OHLCV API | Fetch licensed bars once, then calculate indicators with TA-Lib, pandas-ta, or a version-controlled internal implementation. | Market-data licensing, corporate-action treatment, session calendars, missing bars, library version, warm-up rules, and infrastructure cost. | Backtests, large parameter grids, auditable models, and workflows that require exact historical reproducibility. |
Do not compare only the number of listed indicators. Ten well-documented indicators calculated from reliable, correctly adjusted bars can be more useful than two hundred opaque labels. Start with the exact symbol, market, interval, and parameter set your product needs, then compare the returned timestamps and values on the same completed candles.
How to compare free technical indicator APIs
| Criterion | What to check | Why it matters | Warning |
|---|---|---|---|
| Coverage | Indicators, assets, exchanges, intervals, and history. | Matching the exact product workflow. | Do not infer one market from another. |
| Free limits | Rate limits, credits, endpoint access, and retention. | Prototypes and low-frequency workflows. | Terms and quotas can change. |
| Data quality | Source bars, timestamps, adjustments, precision, and gaps. | Backtests, alerts, dashboards, and agents. | Validate against documented examples. |
| Operations | Authentication, errors, retries, caching, and status visibility. | Reliable production integration. | A free tier is not an SLA. |
Recalculate a fixture before trusting the output. Download a fixed OHLCV sample and reproduce several returned values locally with the provider's stated formula. Match the price field, split and dividend adjustment, session boundary, timezone, bar-completion rule, lookback length, warm-up behavior, rounding, and—for volatility measures—the population or sample convention. Compare timestamps as well as numbers. Two correct implementations can disagree when one includes a still-forming candle or uses adjusted closes, so unexplained equality is not the only goal; a documented and repeatable calculation contract is.
For a chart or personal dashboard
Prioritize simple authentication, stable timestamps, the exact intervals displayed by the chart, and enough history to fill the longest lookback. A pre-calculated endpoint is often the fastest route because the product needs a small, predictable indicator set rather than thousands of parameter combinations.
For alerts and scanning
Quota arithmetic becomes central. Multiply the symbol universe by the number of indicators and polling cycles, then include retries and market-open bursts. Prefer batch requests, completed-candle caching, and explicit stale flags. A free plan that works for five symbols may fail immediately for five hundred.
For backtests and research
Own the historical bars and calculate locally when possible. Backtests need point-in-time data, stable formulas, reproducible library versions, and protection against survivorship, look-ahead, and adjustment errors. A convenient latest-indicator endpoint is not automatically a historical research dataset.
For an AI agent
Return evidence rather than a bare “buy” or “sell.” The tool result should include symbol identity, interval, indicator parameters, value, source-bar time, freshness, provider, and validation status. Require the agent to describe what the indicator measures and avoid presenting one technical signal as investment advice.
How to validate RSI, MACD, and other API values
A successful HTTP response proves only that the endpoint answered. It does not prove that the value matches your chart, backtest, or trading rule. Before accepting a provider, build a small fixture that preserves the exact source bars and makes every calculation choice visible.
1. Freeze one completed-candle dataset
Choose a liquid symbol and export at least 100 bars with symbol, exchange, interval, timezone, open, high, low, close, volume, adjustment status, and candle-close state. Keep the raw response as the acceptance fixture. A moving target cannot diagnose a one-point difference.
2. Reproduce RSI with the same initialization
For a 14-period RSI, confirm whether the first average gain and loss use a simple mean and whether subsequent values use Wilder smoothing. Check whether the provider starts returning a value after 14 changes or 14 rows. That single-row offset is a common source of disagreement.
3. Match MACD inputs, not just 12–26–9
Two MACD series can use the same nominal periods and still differ because of EMA seeding, price precision, missing bars, adjustment mode, or the inclusion of an open candle. Compare the MACD line, signal line, and histogram separately; do not validate only the final crossover label.
4. Test corporate actions and session boundaries
Repeat the check around a split or large dividend and across regular versus extended hours. For crypto, define the daily UTC boundary. A formula can be correct while the input series is wrong for the intended market session.
5. Set tolerances and failure behavior
Define an absolute or relative numeric tolerance before viewing the result. Fail closed when timestamps are stale, required bars are missing, parameters are omitted, or the returned series silently changes order. Store provider, formula parameters, bar timestamp, request time, and validation status with every signal.
Example acceptance rule: accept a completed-bar RSI value only when the provider echoes the requested 14-period configuration, the source timestamp matches the fixture, at least 99% of non-null fixture values fall within the predefined tolerance, and no value appears inside the documented warm-up window. This turns “the chart looks close” into a repeatable test.
Free technical analysis API integration steps
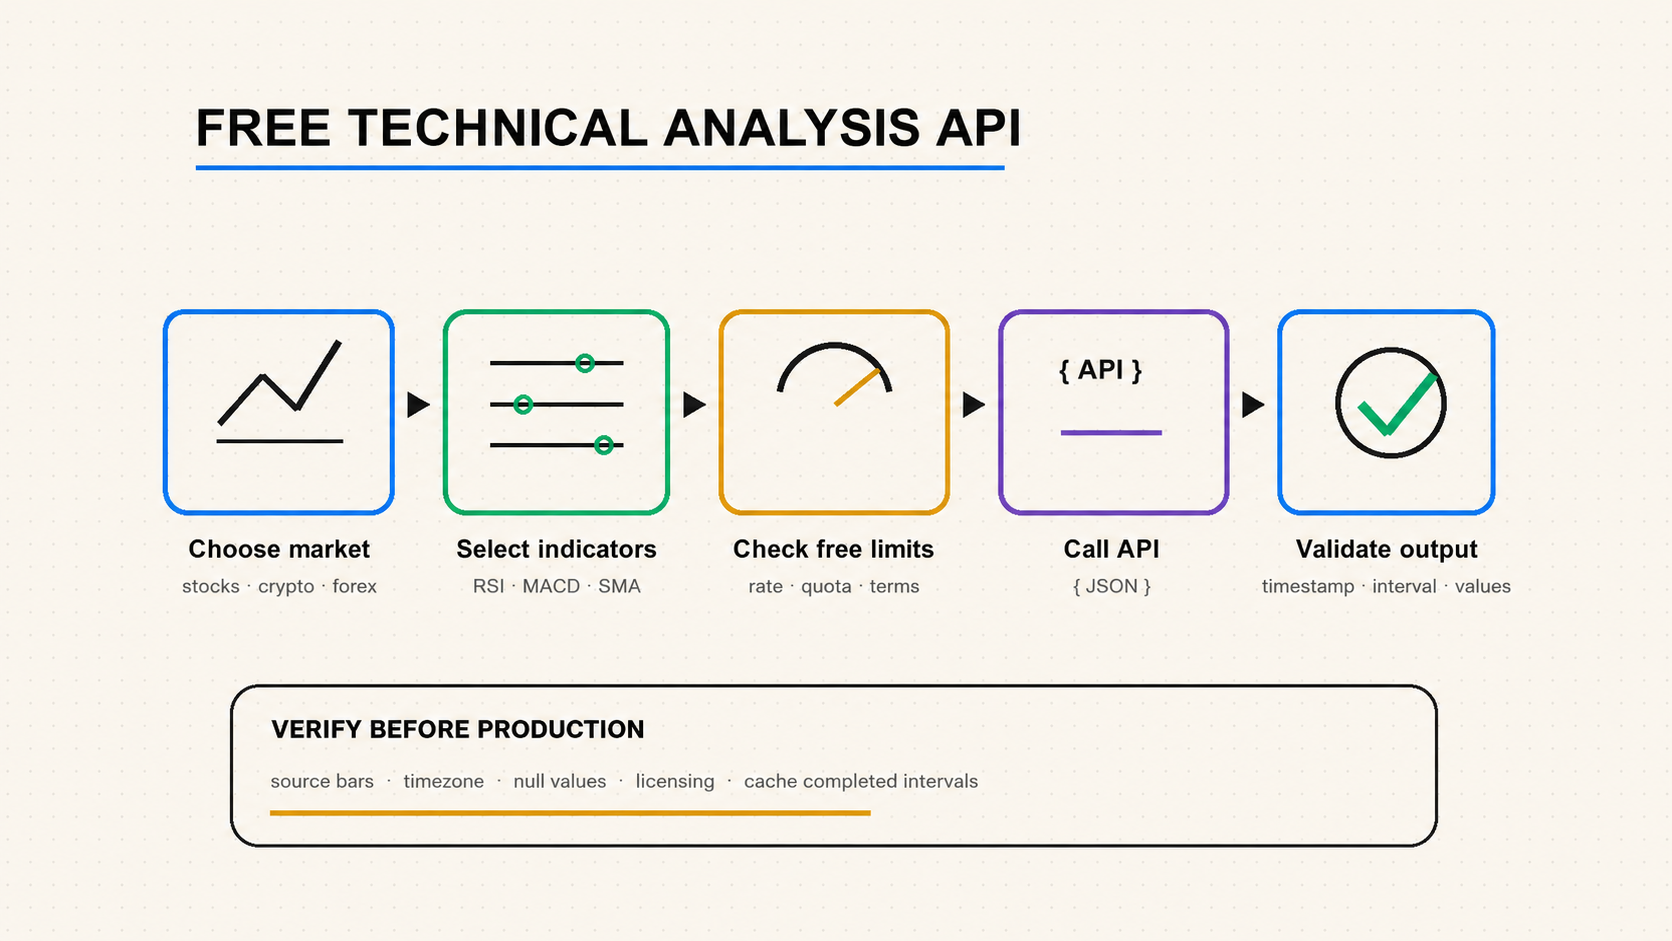
1. Define the market and indicator contract
Write down the symbol format, exchange, interval, timezone, adjustment mode, indicator, parameters, and minimum historical depth before comparing providers.
2. Test one documented API request
Use an official example, keep the key server-side, preserve the raw JSON, and record response headers plus the source-bar timestamp.
3. Normalize technical indicator JSON
Convert numeric strings safely, preserve null warm-up values, map timestamps with timezone awareness, and store provider and calculation parameters.
4. Add limits, caching, and validation
Back off after 429 responses, cache completed bars, reject stale or malformed values, and monitor provider notices before production use.
5. Build a cross-market acceptance set
Test a liquid stock, a corporate-action date, an interval with a gap, an extended-hours session, a 24/7 crypto pair, and a long-lookback indicator. Compare values and timestamps with an independent calculation, preserve warm-up nulls, and define numeric tolerances before reviewing results.
6. Monitor semantic drift
Track freshness, null rate, revision frequency, quota use, response schema, parameter defaults, and fixture disagreement. Stop or label a signal when validation fails. Carrying forward yesterday's value without a stale flag can make an alert or agent answer appear current when its evidence is not.
Use QVeris to find technical analysis API capabilities
QVeris is a capability-routing network, not a market-data provider and not a guarantee that a third-party endpoint remains free. It can help an agent discover technical-analysis tools, inspect inputs and outputs, and call a selected capability under its documented terms.
- Open the EODHD Technical Indicators tool details for RSI, MACD, moving averages, and market-specific analysis capabilities.
- Inspect each tool’s symbol format, interval, parameters, output schema, provider identity, and published restrictions before calling it.
- Use the QVeris REST API reference to connect the selected capability to an agent workflow.
Free technical analysis API FAQ
Is there a free API for technical analysis?
Yes. Some providers offer limited free tiers for pre-calculated indicators. Confirm supported markets, endpoint access, delays, quotas, and commercial-use terms on current official pages.
Which technical indicators can an API return?
Common endpoints include RSI, MACD, SMA, EMA, Bollinger Bands, ATR, ADX, stochastic oscillators, and other price- or volume-derived series.
Can a free technical analysis API provide real-time data?
Sometimes. It depends on market-data entitlements and free-plan rules. Verify the source timestamp and documented delay rather than response speed.
How do I choose a technical indicator API?
Match asset class, indicators, intervals, history, schema, quotas, licensing, status visibility, and reliability to the exact application requirement.