
Free Stock Data
with Python
Fetch stock prices into pandas, compare free data sources, and validate timestamps, adjustments, limits, and licenses before you build.
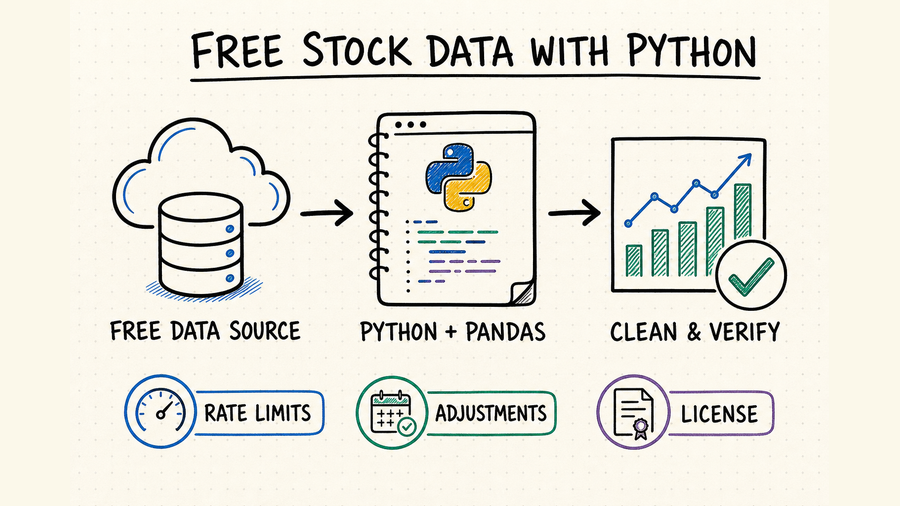
TL;DR
Use a documented API or provider SDK, load JSON into pandas, and save a raw copy before transforming it.
Expect delayed quotes, end-of-day history, request caps, narrower exchange coverage, or non-commercial terms.
Check timestamps, time zones, split and dividend adjustments, symbol formats, nulls, and duplicate rows.
Choose a free stock data source for Python
Start with the data shape your project needs—not the library name. Historical research needs stable OHLCV and corporate actions; a dashboard needs current quotes and explicit freshness; screening needs fundamentals and consistent identifiers.
Best when you need predictable JSON, documented fields, API keys, and explicit request limits. Prefer sources that expose timestamps and adjustment policy.
Useful for notebooks and prototypes. They reduce setup, but may wrap endpoints that change, so pin versions and test returned columns.
CSV works for exchange and one-off analysis; Parquet is more efficient for typed, partitioned history. Preserve the raw source file before cleaning either format.
Use one module to fetch and normalize data and another to calculate indicators or models. This makes provider changes testable and keeps notebooks reproducible.
Python example: fetch prices into pandas
A provider-neutral pattern uses requests for transport and pandas for normalization. Replace the endpoint and field names with those in your provider’s documentation.
import os
import requests
import pandas as pd

url = "https://api.example.com/v1/daily"
params = {"symbol": "AAPL", "apikey": os.environ["STOCK_API_KEY"]}
response = requests.get(url, params=params, timeout=20)
response.raise_for_status()

rows = response.json()["data"]
df = pd.DataFrame(rows)
df["date"] = pd.to_datetime(df["date"], utc=True)
df = df.sort_values("date").drop_duplicates("date")
print(df[["date", "open", "high", "low", "close", "volume"]].tail())| Step | Why it matters | Minimum check |
|---|---|---|
| Request | Timeouts and HTTP errors prevent silent failures. | Status code and provider error body. |
| Normalize | Stable columns isolate analysis from provider schemas. | Types, UTC dates, numeric columns. |
| Validate | Bad rows can produce believable but wrong charts. | Order, duplicates, nulls, price bounds. |
For repeated jobs, write normalized data into partitions such as market/symbol/year or market/date, depending on the dominant query. Keep a manifest with provider, parameters, retrieval time, schema version, row count, and checksum. Re-fetch a short overlap on every update so late corrections can replace recent records deterministically.
Validate free stock data before analysis
Compare the newest timestamp with the exchange session and expected delay. Weekends and holidays are not missing data.
Confirm whether close prices are raw or adjusted for splits and dividends. Never mix adjusted and unadjusted series.
Require expected columns, coerce price fields explicitly, preserve wide integer volume, reject duplicate keys, and fail when an HTML error page is parsed as data.
Check high ≥ max(open, close), low ≤ min(open, close), nonnegative volume, monotonic timestamps, and one currency per instrument unless a change is documented.
Pin library versions, save request inputs and raw payload hashes, and avoid silently refreshing historical data inside an analysis notebook.
Use QVeris for provider-flexible stock data access
There is no single verified QVeris result for every Python stock-data pipeline. Use the QVeris Python SDK documentation for integration and the Playground to inspect candidate capabilities before mapping them into your normalized schema.
- Discover stock-data capabilities and inspect their inputs before calling them.
- Keep application code focused on symbols, dates, and normalized outputs.
- Use auditable capability calls when agents need current financial data.
FAQ
Yes. Free APIs, public datasets, and Python libraries can provide historical prices, delayed quotes, fundamentals, or metadata within plan limits.
Use pandas for cleaning and analysis, requests for direct APIs, or a provider SDK for convenience. Normalize results into a DataFrame.
CSV is portable and easy to inspect. Parquet preserves types, compresses well, and supports selective reads, making it better for larger recurring datasets.
Refresh the newest overlap on each run and audit provider corrections periodically. Immutable older partitions reduce cost while keeping revisions traceable.
References and next steps
Alpha Vantage API documentation
Alpaca market data documentation
Twelve Data API documentation
QVeris Python SDK
QVeris Playground