
Free Short Volume API for US Stocks
Verify reporting facilities, trade dates, denominators, short-exempt volume, publication timing, and revisions.
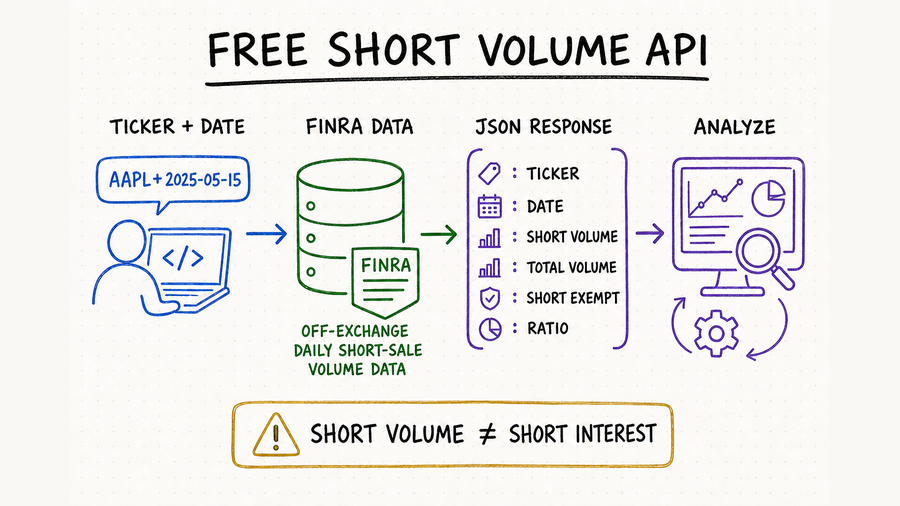
What a free short volume API actually covers
Daily short-sale volume reported to FINRA comes from defined reporting facilities and often includes off-exchange venues and alternative trading systems. A provider may consolidate facilities or expose venue-level rows, so compare its methodology before combining dates or symbols.
FINRA explains that its daily files cover qualifying publicly disseminated short-sale activity reported through specified facilities. They are not automatically consolidated with each exchange, and some offsetting buy activity is outside the file. Therefore a high ratio can describe the composition of the covered reportable flow without proving that most market participants are building bearish positions.
FINRA short-volume files are generally used as daily data. Do not label an endpoint real time unless the provider documents update timing.
Total volume in the response may mean total reported volume within the dataset, not consolidated market-wide share volume.
Short volume measures trading activity during a period. Short interest measures shares remaining short at a reporting date.
A free endpoint can restrict commercial use or redistribution. Check current terms before placing data in a public product.
If the API returns TRF, ADF, or other venue-level records, aggregate only after checking whether symbols, dates, corrections, and total-volume definitions align. Preserve facility-level inputs beside any derived combined value.
Short marking can occur in liquidity provision and other workflows, and a trade can be offset the same day. Interpret the ratio with price, spread, total liquidity, events, and later short-interest snapshots.
TL;DR
A daily short volume API typically returns ticker, trade date, short volume, short-exempt volume, total reported volume, and a ratio.
Free may mean a sample, trial, or rate-limited tier. Confirm history, symbol coverage, redistribution rights, and request quotas.
FINRA short-sale volume is reported activity from specified facilities; it is not the same as total exchange volume or outstanding short interest.
Use it for research, monitoring, and feature engineering with price, liquidity, and event context—not as a standalone trading signal.
Where to get free daily short-sale volume data
Use FINRA Short Sale Volume Data when you need the published files and their documented scope. Use a normalized provider such as the documented Massive Short Volume API when your application needs ticker queries, JSON, or easier historical retrieval. A capability layer can help an Agent discover either route, but it must keep the underlying dataset and facility coverage visible.
| Route | Best fit | Verify |
|---|---|---|
| FINRA daily files | Direct source ingestion, independent validation, bulk daily research, and a benchmark for provider rows. | File type and facility, trade date, symbol rules, corrections, publication schedule, and whether every expected file arrived. |
| FINRA Data / developer access | Discovering documented datasets and building workflows around FINRA's available data interfaces. | Dataset identity, authentication where applicable, filters, async behavior, limits, and current terms rather than assuming the file and API contracts are identical. |
| Normalized market-data API | Applications that need REST or JSON, symbol and date filters, pagination, and integration with price or reference data. | Whether data is FINRA-sourced, facility-level or consolidated, the denominator used, history, revisions, free limits, and redistribution rights. |
Worked ratio example: 62% is not a market-wide bearish vote
Suppose a covered FINRA dataset reports 620,000 short shares and 1,000,000 total reported shares for a symbol. The ratio is 62% within that dataset. If consolidated market volume for the day is 2,500,000 shares, the API denominator covers only part of total activity. Dividing by the market-wide number instead would produce 24.8%, but that new ratio mixes scopes and is not automatically a valid FINRA metric. The correct output states the numerator, denominator, facilities, and trade date together.
Two failure cases that can reverse the interpretation
Missing facility: if one expected facility file is absent, a consolidated ratio may move even when underlying behavior did not. Mark the date incomplete and recompute only after the missing component arrives. Same-day offset: a liquidity provider can execute a short-marked sale and purchase shares later that day; the short-volume file records the sale activity, not the end-of-day open position. Short interest, borrow data, price action, and event context answer different questions.
Choose the output by use case
Show short, exempt, and total reported volume, ratio, facility set, trade date, publication state, and completeness warning together.
Freeze source versions, reject changing coverage, preserve missing days, and join price or events only after calendar and identifier checks.
Require the Agent to describe the dataset scope and avoid causal or bearish claims unless supported by additional evidence.
Verify redistribution rights, cite the source, expose methodology, and distinguish provider-derived ratios from original reported fields.
Free short volume API fields to validate
| Field | Meaning | Validation | Common risk |
|---|---|---|---|
| ticker / symbol | The US security identifier requested. | Check exchange and identifier normalization. | OTC, class shares, or renamed symbols. |
| trade_date | The reporting trade date. | Use documented timezone and calendar. | Treating publish time as trade time. |
| short_volume | Reported shares sold short. | Confirm consolidated or facility-level scope. | Assuming it equals open short positions. |
| total_volume / ratio | Dataset total and derived short share. | Recalculate ratio and inspect denominator. | Comparing against market-wide volume. |
| short_exempt_volume | Reported short-sale volume marked exempt under applicable rules. | Whether it is included in short volume and ratio calculations. | Adding it twice or dropping it without documenting the formula. |
| facility / venue | Reporting source such as a TRF or ADF. | Whether the row is facility-level or already consolidated. | Summing a consolidated row with its components. |
| publish / revision metadata | When the file was available and whether it was corrected. | Retrieval time, source version, and overwrite policy. | Using revised history in a point-in-time backtest. |
How to use a FINRA short volume API safely
1. Confirm data origin and update timing
Read the provider methodology: reporting facilities, consolidation rules, publication schedule, historical start date, and corrections policy.
2. Query historical short volume by ticker and date
Use a documented example, inspect HTTP status and pagination, then save the raw response before transforming fields.
3. Recalculate the short volume ratio
Where the denominator is documented, verify short_volume ÷ total_volume. Keep nulls distinct from zeros.
4. Add context and monitoring
Join by a verified trading date, log provider and timestamp, detect late revisions, and combine with price or liquidity data only after aligning coverage.
5. Build a coverage matrix
For every date, record which facilities and exchanges are represented, whether the provider supplies components or a consolidated row, and which denominator supports the ratio. Reject cross-date comparisons when the coverage set changes silently.
6. Validate with event-day controls
Test high-volume earnings days, halts, symbol changes, splits, OTC securities, missing facility files, and late corrections. Measure duplicate rate, missing-date rate, ratio-recalculation error, and the delay between trade date and usable publication.
How QVeris helps find and call short-volume data
QVeris helps agents discover and inspect capabilities for daily short volume, venue-level files, ratios, or short-interest snapshots. Before calling one, the agent should state the exact dataset, ticker or stable security ID, trade-date range, facility scope, denominator, and point-in-time cutoff. It must not answer a short-interest question with daily volume or describe a facility-specific ratio as market-wide. Provider access, quotas, and data rights still apply.
- Open the Massive Stocks Short Volume tool details for the precise ticker-and-date capability.
- Inspect schemas before calling, especially units, venue coverage, pagination, and missing-value behavior.
- Keep the provider response and metadata available for review instead of treating one ratio as a conclusion.
Review QVeris REST API reference.
FAQ
Some providers offer sample access, trials, or free tiers, and FINRA publishes daily files. Verify history, quota, symbol mapping, facility coverage, corrections, licensing, and whether the response is raw or already consolidated.
Short volume measures reportable short-sale transactions during a trade date. Short interest is an open-position snapshot on designated settlement dates. A same-day short and cover can appear in volume but not remain in short interest.
It is commonly short volume divided by total reported volume within the same dataset and facility scope. Confirm whether short-exempt volume is included, avoid mixing venue components with consolidated rows, and store the denominator.
Not by itself. FINRA notes that its files are not automatically consolidated with exchange data. A complete market view requires compatible data from the relevant reporting facilities and exchanges, with duplicate and denominator rules defined.
The file does not show every offsetting buy and covers a defined reporting universe. Short marking can also occur in liquidity workflows. A high ratio is not proof that the same percentage of shares became persistent bearish positions.
Not reliably on its own. Use it as a documented feature alongside price response, liquidity, spreads, events, venue coverage, and later position data, then validate out of sample without revised-history leakage.