
Free Historical
Stock Price API
Choose a free API by coverage, adjustment quality, frequency, and limits—then validate the data before you build.
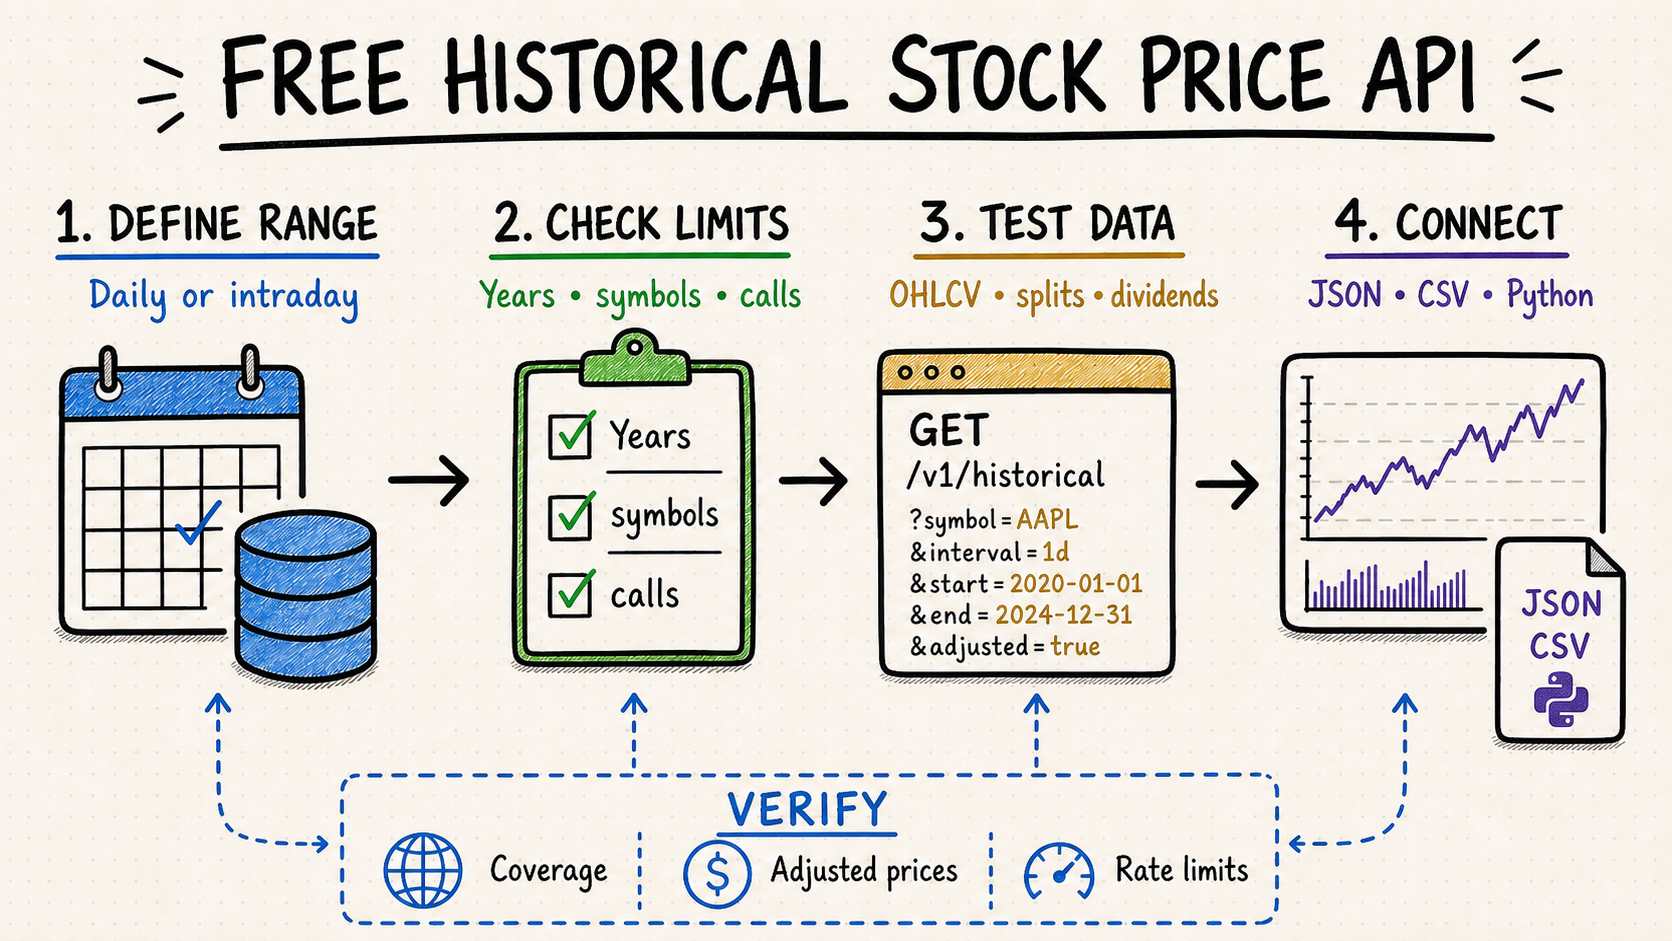
TL;DR
A good free historical stock price API covers your exchanges, date range, intervals, and symbol count without hiding essential data behind a paid tier.
At minimum, request timestamp, open, high, low, close, and volume. For return analysis, verify splits, dividends, and adjusted close.
Free plans commonly restrict calls per minute, rows per response, history depth, intraday retention, or commercial use.
Test several symbols and corporate-action dates before committing your database schema or research pipeline.
For long-horizon returns and portfolio research, daily adjusted OHLCV is usually the right free starting point. For charting an entry inside a session, require intraday bars with explicit interval boundaries and retention. For event studies, preserve both raw and adjusted prices plus the corporate-action events that connect them. The right API is therefore the one whose price semantics match the calculation—not simply the source with the longest advertised history.
What historical stock price data should include
“Historical price?can mean an unadjusted daily close, a full OHLCV bar, or years of intraday candles. Define the dataset precisely before comparing providers.
Confirm timestamp timezone, trading calendar, interval definitions, and whether zero-volume or missing sessions are omitted.
Splits and dividends change historical comparability. Check whether the API returns raw values, adjusted values, or both, and document the adjustment method.
Identify the primary listing, trading currency, regular or extended session, venue calendar, and whether a daily close means auction close, official close, last trade, or provider-selected value.
Prefer separate split and cash-distribution factors or events alongside adjusted OHLCV. Confirm whether volume is inversely adjusted, whether dividends affect every price field, and when a correction changes historical factors.
Keep stable security and listing IDs, ticker effective dates, IPO date, delisting date, exchange transfers, share-class changes, and trading halts. Today’s ticker list is not a valid historical universe.
For minute or hourly data, document event time versus receipt time, interval start or end labels, session breaks, auction prints, late trades, corrections, and whether empty intervals are omitted or emitted.
Retain provider, endpoint, request parameters, retrieval time, source timestamps, schema version, and raw response. Historical prices can be restated after corrections or later corporate-action processing.
Free historical stock price data sources to evaluate
A provider name alone is not a recommendation. The same provider may expose daily, adjusted daily, intraday, or bulk-download products with different coverage and plan boundaries. Start with the route that matches your workload, then confirm current access, licensing, retention, and adjustment semantics in the official documentation.
| Route | Useful for | Verify before choosing |
|---|---|---|
| Alpha Vantage | JSON or CSV time-series workflows, especially prototypes that combine prices with other documented market-data functions. | Whether the required raw or adjusted endpoint is available on the current plan, output-size limits, call frequency, and the precise adjustment fields returned. |
| Massive | US stock aggregate bars where interval construction, timestamps, and market-data context need to be explicit. | Current free access, history window, adjusted parameter behavior, pagination, venue coverage, and commercial terms. |
| Stooq CSV download | Manual exploration, spreadsheets, and lightweight research that can ingest downloadable daily files. | Symbol conventions, exchange suffixes, update schedule, adjustment basis, automation suitability, and redistribution terms. |
| Exchange or issuer records | A truth set for corporate actions, ticker history, official calendars, and disputed price dates. | This is usually a validation source rather than a convenient normalized API; document how each record maps to the provider series. |
Do not freeze plan claims into application logic. Free quotas and endpoint access can change. Store the provider, endpoint, parameters, documentation date, and observed response contract so a later change can be diagnosed rather than mistaken for missing market data.
Worked example: a 2-for-1 split is not a 50% loss
Assume a stock closes at $100 on Monday and begins trading at $50 on Tuesday after a 2-for-1 split. A raw close series shows 100 then 50, which looks like a ?0% return. A split-adjusted series restates Monday's comparable close to $50 and usually adjusts historical volume in the opposite direction, so the economic return across the split is approximately 0% before ordinary price movement. If an API adjusts only the close but your strategy uses open, high, or low, signals can still be distorted.
Cash dividends require a different decision
Suppose a stock closes at $50 before a $1 cash dividend and opens near $49 after going ex-dividend. A raw price-return series records a decline, while a total-return series treats the distribution as value received by the shareholder. Neither series is universally “correct? charting the traded price calls for raw bars, estimating shareholder wealth calls for a documented total-return adjustment, and an event study may need both plus the dividend record. Keep the method in metadata instead of naming every transformed field simply adjusted_close.
How to compare free historical stock APIs
| Option | Strength | Check first | Best fit |
|---|---|---|---|
| Daily OHLCV API | Long history and smaller payloads. | Adjusted prices, delisted stocks, exchange coverage. | Backtests and portfolio research. |
| Intraday API | Fine-grained bars for trading analysis. | Retention window, call limits, market hours. | Signals, charts, and execution research. |
| CSV download | Simple bulk analysis with no client library. | Automation, refresh cadence, file schema. | Spreadsheets and one-off research. |
| Unified data tool | One discovery and calling layer across providers. | Source transparency and normalized fields. | Agents and multi-source workflows. |
Run one identical acceptance query against every candidate: a liquid stock, a recent IPO, a ticker change, a delisted security, a split, a special dividend, a foreign listing, and a day with an exchange closure or early close. Compare row counts, timestamps, currencies, raw and adjusted values, volume treatment, and revision behavior. A provider that returns HTTP 200 but omits a delisted symbol or silently changes the adjustment basis has failed the historical-price test.
Choose the API by the final calculation
Use raw OHLCV with a clear exchange, session, timezone, and latest completed interval. Add corporate-action markers rather than rewriting the visible traded price.
Require adjusted history or reproducible factors, dividend events, delisted securities, and point-in-time identifiers.
Preserve raw and adjusted bars, exact event dates, publication timestamps, and a control window around the event.
Prioritize long intraday retention, deterministic bar construction, session flags, corrections, and realistic data availability time.
A practical integration checklist
List exchanges, symbols, start date, interval, timezone, adjustment preference, fields, update cadence, and intended use.
Compare a liquid stock, a split date, a dividend date, a delisted symbol, and a non-US exchange against a trusted exchange or issuer source.
Add pagination, caching, exponential backoff, request logging, and checkpointed downloads. Never assume a free limit is permanent.
Store untouched provider rows, corporate-action events, factors, and normalized bars separately. Do not overwrite raw closes with adjusted values or discard the factor used.
Check OHLC invariants, negative or impossible prices, duplicate timestamps, missing sessions, timezone shifts, currency changes, volume spikes, and continuity around splits before publishing a series.
Fingerprint requests, checkpoint pages and symbols, freeze source versions, and record correction dates. A repeated run should explain every changed row.
Alert on schema drift, delayed updates, falling symbol coverage, quota changes, silent partial responses, and license changes; keep a documented fallback for critical workloads.
Use QVeris to discover callable market data
Free plans and endpoints change. QVeris helps agents discover and inspect historical-price capabilities by market, interval, date range, identifier, format, and documented provider boundary before routing a request. It can simplify capability access; the application still owns adjustment policy, trading-calendar logic, point-in-time universes, raw-data retention, quality gates, reproducibility, and licensing.
- Search for capabilities by required market, interval, format, and action.
- Inspect tool inputs and outputs before an agent commits to a provider-specific call.
- Keep discovery and execution auditable when workflows span several financial sources.
FAQ
Yes. Many APIs offer free daily history, but coverage, history depth, call limits, licensing, and adjusted data vary.
JSON is usually easiest for applications and Python scripts. CSV is often better for bulk downloads, spreadsheets, and reproducible archives.
Adjusted close is enough for some return series, but strategy logic using opens, highs, or lows needs consistently adjusted OHLC and volume or access to the factors required to calculate them.
It depends on the series. A total-return adjustment incorporates cash distributions; a split-only series does not. Label the method and retain the dividend event rather than assuming every “adjusted?field means total return.
No. It excludes delisted and renamed securities and creates survivorship bias. Build the universe from point-in-time listing status and effective identifier history.
They may use different venues, official versus last-trade closes, sessions, currencies, correction timing, or adjustment methods. Compare metadata and raw events before deciding one value is wrong.