
Free Historical Stock Data API for Backtesting
Compare free historical stock APIs by time span, market coverage, adjustments, frequency, limits, and licensing before you backfill a dataset.
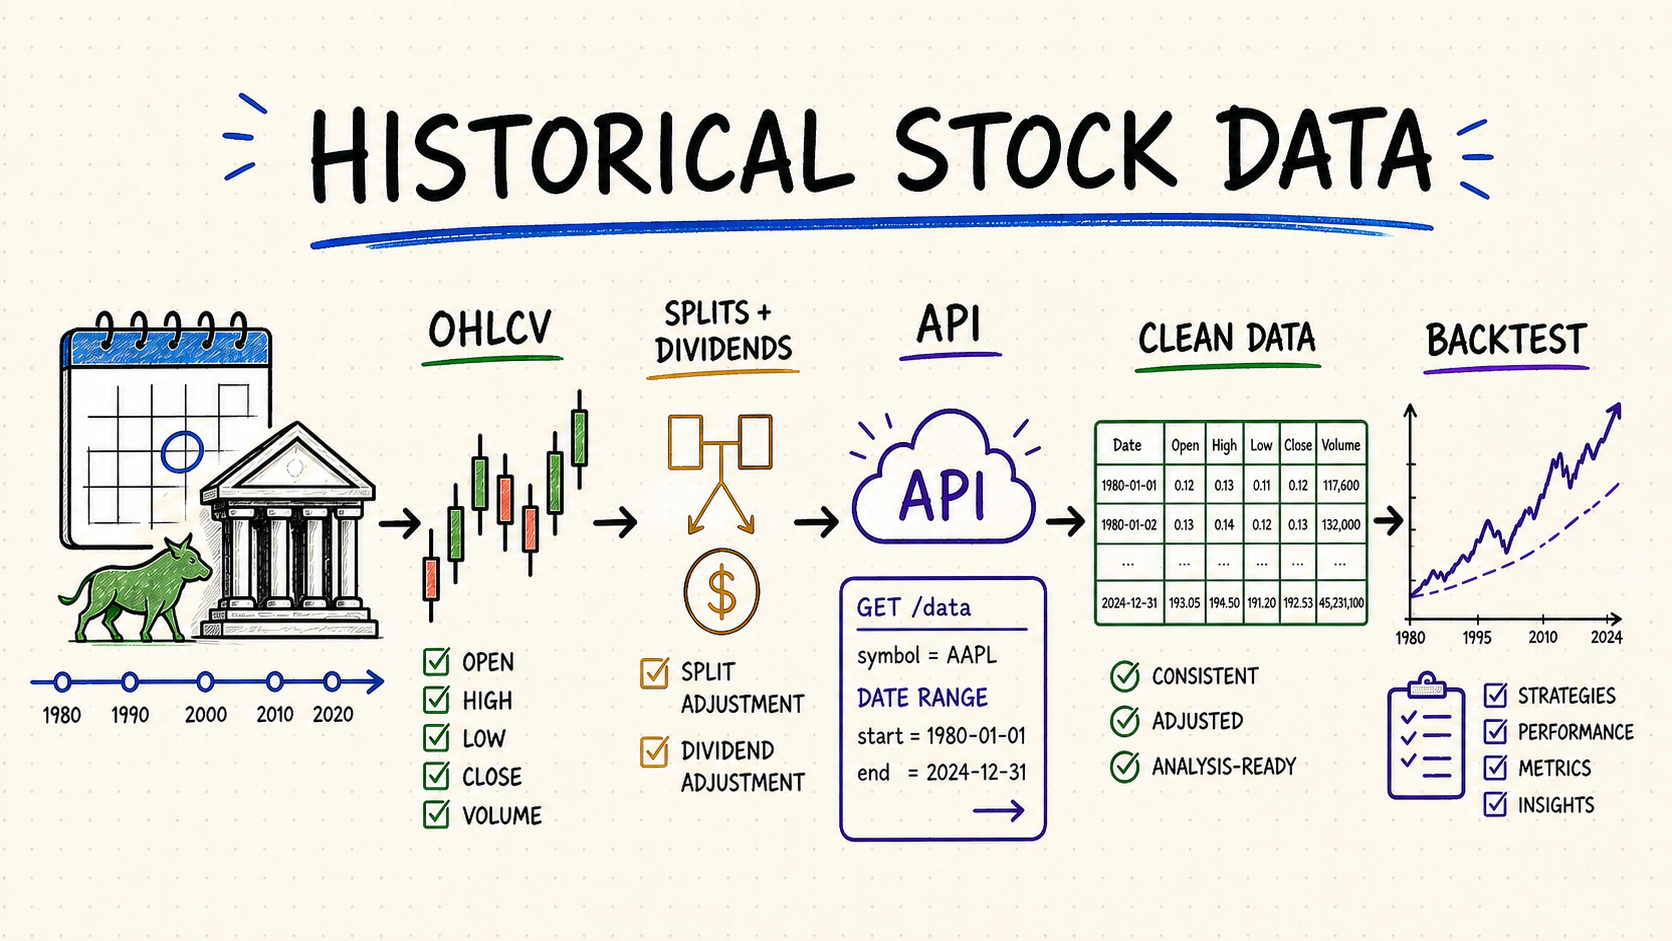
Quick answer: what “free historical stock market data API” means
A free historical stock market data API should support more than one ticker’s price history. For market-wide research it must help reconstruct which securities were listed on each date, their identifiers and venues, daily or intraday OHLCV, corporate actions, and the calendar or benchmark context needed to compare them. A useful free tier exposes enough history and breadth for the intended universe, documents adjustments, and permits the planned use.
Backtests, factor research, screeners, portfolio analytics, model training, and reproducible market studies.
Start dates, bar intervals, delisted symbols, and corporate-action treatment vary by provider and exchange.
Expect caps on lookback, calls, symbols, intraday history, bulk export, redistribution, or commercial use.
This page is about building a point-in-time market panel for cross-sectional backtests, factor research, breadth statistics, and universe screening. If the requirement is only one security’s raw or adjusted price series, a historical stock price API is the narrower fit. Market-wide work adds a harder problem: the universe itself changes through IPOs, delistings, mergers, ticker changes, share-class events, and exchange transfers.
What historical stock data should include
| Field | What it tells you | What to verify |
|---|---|---|
| OHLCV | Price bars across the requested date range. | Interval, timezone, calendar, and missing sessions. |
| Coverage | Exchanges, securities, first available date, and granularity. | Delisted assets and survivorship bias. |
| Adjusted close | A series normalized for splits and sometimes dividends. | Adjustment method and revision timing. |
| Symbol metadata | Ticker, exchange, currency, and asset identity. | Delisted tickers and symbol changes. |
| Point-in-time universe | Listing, delisting, security type, primary venue, and status effective dates. | Today’s survivors are not substituted for the historical market. |
| Corporate actions | Splits, dividends, mergers, spin-offs, symbol and share-class changes. | Effective date, factor, cash amount, currency, and successor mapping. |
| Market context | Venue calendar, market status, benchmarks, sectors, and classifications. | Taxonomy and index membership are versioned point in time. |
| Provenance | Provider, endpoint, source time, retrieval time, and dataset version. | Corrections and later backfills remain explainable. |
Reproduce one adjustment before trusting the series
Assume a stock closes at $100 and completes a 2-for-1 split before the next session. A raw series may show the next comparable price near $50; a split-adjusted series should restate the earlier $100 close to $50 so the chart does not report a false 50% loss. If the provider adjusts volume consistently, one million pre-split shares become two million split-adjusted shares. Price and volume factors move in opposite directions, so applying the price factor to both fields corrupts turnover and liquidity research.
| Series | Example result | Appropriate use |
|---|---|---|
| Raw close | $100 before split, about $50 after split | Reconstructing the price actually printed on each date |
| Split-adjusted close | Earlier close restated from $100 to $50 | Price continuity and return calculations that exclude cash dividends |
| Total-return series | A $50 close followed by a $49 ex-dividend close plus a $1 dividend gives 0% total return, not −2% | Performance analysis that reinvests or credits distributions |
Do not accept a field named adjusted_close until the documentation states whether it includes splits, cash dividends, special dividends, rights issues, and later corrections. Save the raw bar, corporate-action record, provider factor, and dataset version so the adjusted value can be reproduced after a revision.
How to evaluate a free historical stock market data API
Check the exact exchanges, countries, ETFs, indices, and delisted securities you need. “Global” can still exclude important venues.
Know whether adjusted prices account for splits, dividends, or both, and whether historical values may be revised.
Translate per-minute and daily limits into your symbol count, backfill depth, retry policy, and update schedule.
Free access may permit personal research but restrict redistribution, display, caching, or commercial products.
Request listing and status history, not only current symbols. Test IPOs, bankruptcies, mergers, exchange transfers, foreign listings, ADRs, ETFs, and multiple share classes with stable IDs.
For several historical dates, compare expected and returned security counts by venue and type. Track missing-price rates, stale observations, null volume, currency gaps, and concentration in the covered universe.
Industry, sector, country, index membership, and primary listing can change. Confirm whether the API provides effective dates or only today’s classification.
Convert quotas, pagination, rows per response, and history windows into the cost and time to rebuild the entire market panel, including retries and daily updates.
A reliable historical-data ingestion workflow
- Backfill a small group of symbols and compare dates, OHLCV values, and adjustments with an exchange or issuer reference.
- Store raw responses separately from normalized bars so revisions remain auditable.
- Backfill in bounded date windows, checkpoint each batch, and resume safely after throttling or transient failures.
- Validate duplicates, gaps, zero volume, impossible prices, currency changes, and split discontinuities before analysis.
- Build the security master first, with company, listing, share-class, ticker, venue, currency, and status effective dates.
- Create dated universe snapshots from listing status and eligibility rules; never derive past constituents from the current endpoint.
- Join prices, corporate actions, classifications, and benchmark membership by stable IDs and valid-time intervals rather than ticker text alone.
- Publish a coverage report for every research date, including expected securities, returned rows, missing prices, stale values, exclusions, and dataset version.
Validate the universe with two dated snapshots
Use a deliberately small test universe. On January 31, securities A, B, and C are eligible. B delists on February 15, D completes its IPO on March 1, and C changes ticker while retaining the same stable security ID. The January snapshot must remain A, B, and C; the March snapshot should contain A, C under its new ticker, and D. Building January from today’s active-symbol endpoint would wrongly remove B and insert D—the exact survivorship and look-ahead errors a market-wide API must prevent.
Acceptance output: for each snapshot, retain the effective date, stable security ID, ticker valid on that date, venue, listing status, eligibility reason, exclusion reason, price availability, and source dataset version. A missing bar is not permission to remove a security; it must remain in the universe with a reason such as halt, no trade, feed gap, or unavailable history.
Use QVeris to discover stock data capabilities
QVeris helps agents discover and inspect callable historical market-data capabilities without hardcoding one provider first. Compare market coverage, identifier inputs, date-range and bulk behavior, returned fields, access requirements, and documented limits before routing a request. The application still owns point-in-time universe construction, security-master history, adjustments, classification versions, coverage reporting, licensing, and reproducibility.
FAQ
Some providers offer free tiers, but limits and licenses vary. Verify exchanges, history, adjustments, request caps, and permitted use.
Not always. Some APIs return raw and adjusted series; others require a separate endpoint or paid plan.
A price API can answer one symbol and date range. Market-wide research also needs the point-in-time security universe, identifier history, listings, delistings, classifications, corporate actions, and coverage evidence.
Removing failures and acquired companies leaves only survivors, which can inflate returns and distort factor distributions. Retain delisting dates, final prices, successor mappings, and the reason coverage ended.
No. Index membership changes through additions, deletions, mergers, and methodology reviews. Use effective-dated constituent history or describe the universe as a present-day cohort study.
For each date and venue, report expected eligible securities, returned securities, missing and stale prices, excluded types, identifier failures, currency gaps, and the exact source version.