
How to Choose a Free Financial Ratios API
Evaluate ratio coverage, accounting periods, update schedules, free-plan limits, and licensing before you build.
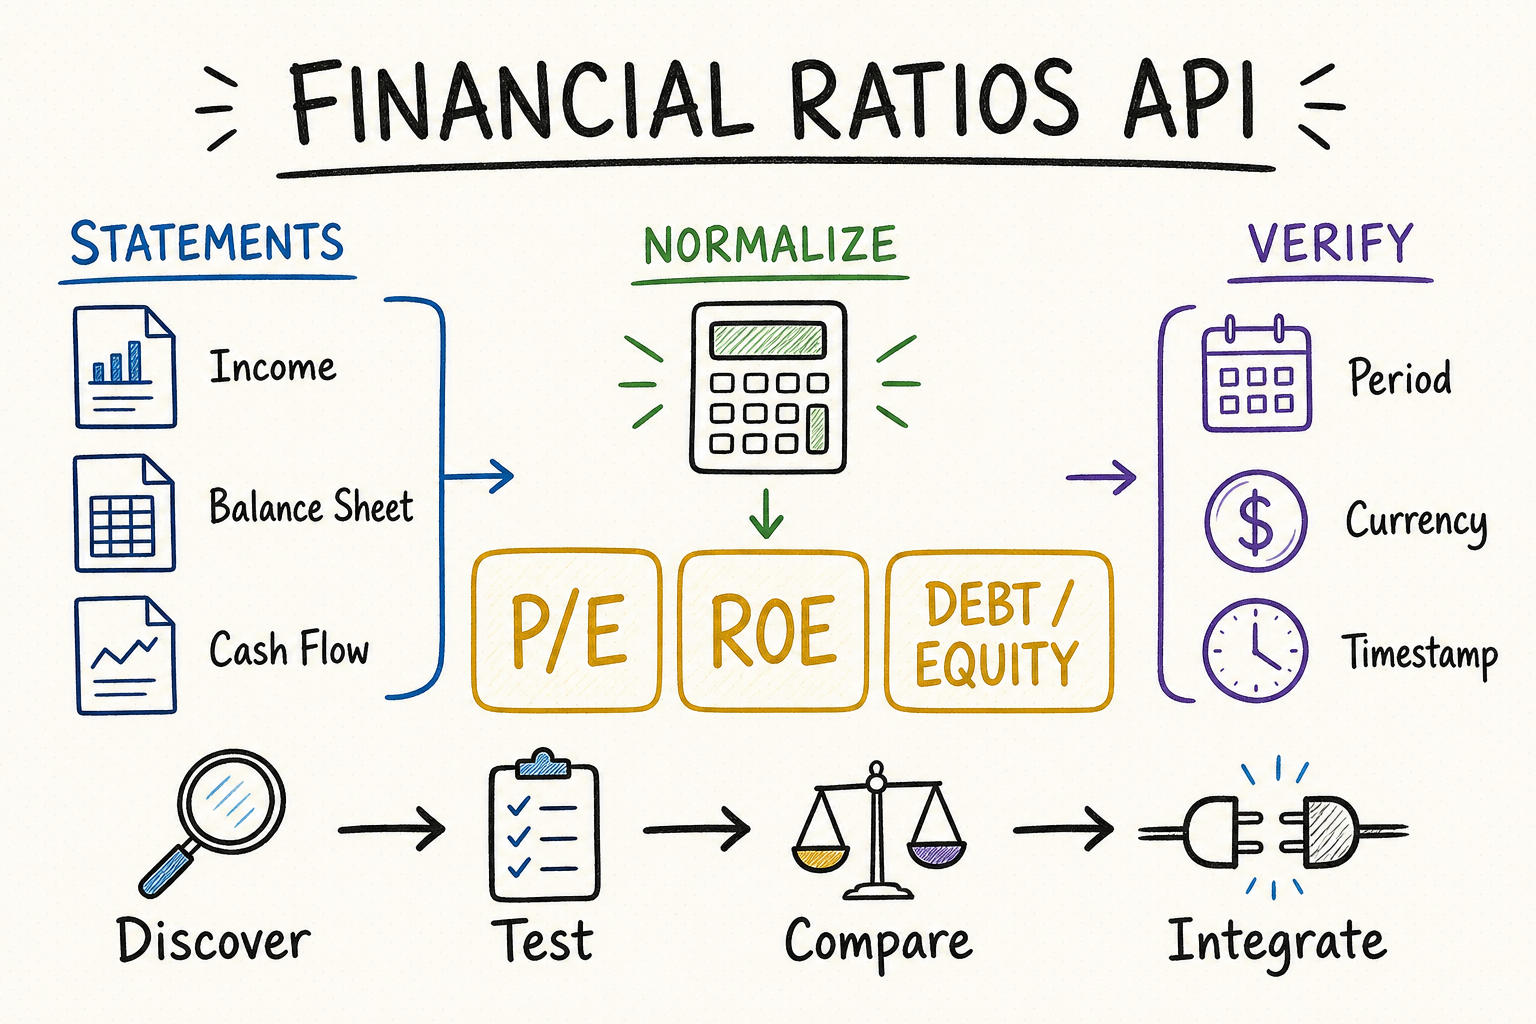
Free financial ratios API summary
A free financial ratios API is useful when it does more than return a convenient list of numbers. The response should explain which statement period and market-price timestamp produced each ratio, expose enough source data to reproduce important calculations, and distinguish values that are unavailable from values that are mathematically undefined. For screening or AI-generated research, comparability matters more than the sheer number of fields.
Look beyond P/E to valuation, profitability, liquidity, efficiency, and leverage ratios.
Confirm whether values are annual, quarterly, or trailing twelve months.
Check quotas, symbol coverage, history, redistribution rights, and permitted uses.
Validate ratios against statements and save formulas, timestamps, and responses.
Which financial ratios should the API cover?
Every calculated value needs a source period and components. Price-based ratios move with the market; statement-based ratios change after filings or restatements. A ratio without an as-of date, fiscal period, currency, and formula is incomplete. The API should also state whether it uses reported GAAP or IFRS values, normalized values, or provider-adjusted figures, because these choices can materially change peer rankings.
Cover trailing and forward P/E, price-to-book, price-to-sales, enterprise-value multiples, and free-cash-flow yield. Check whether the denominator is trailing twelve months, the latest fiscal year, consensus estimates, or a provider model. A negative P/E should normally be null or explicitly flagged rather than displayed as a meaningful bargain signal.
Gross, operating, and net margins answer different questions. ROA, ROE, and ROIC additionally depend on the denominator, average-balance method, tax treatment, and definition of invested capital. Keep these components visible when the ratio will drive a ranking.
Current, quick, cash, debt-to-equity, debt-to-assets, net-debt, and interest-coverage ratios help assess resilience. Confirm how leases, preferred stock, minority interest, and restricted cash are treated. Banks and insurers require sector-specific measures rather than generic industrial-company thresholds.
Receivables, inventory, asset turnover, days-sales-outstanding, and multi-period growth rates reveal how the business converts resources into revenue. Growth calculations need an explicit start period, end period, and handling rule for negative or near-zero bases.
EPS, book value per share, operating cash flow per share, free cash flow margin, and cash-conversion ratios require split-adjusted share counts and a documented free-cash-flow formula. Basic and diluted share counts should not be mixed silently.
A small reconciliation fixture is more useful than checking whether a value “looks reasonable.” The examples below use simplified numbers to show which source fields and dates must travel with each ratio.
| Ratio example | Reproducible calculation | Metadata that changes the answer |
|---|---|---|
| Trailing P/E | Share price $48 ÷ TTM diluted EPS $3 = 16×. | Price timestamp, primary listing, TTM period end, diluted versus basic EPS, split adjustment, and reported versus adjusted earnings. |
| Forward P/E | Same price $48 ÷ next-fiscal-year EPS consensus $4 = 12×. | Forecast period, consensus as-of time, contributor count, GAAP or adjusted basis, currency, and stale-estimate policy. It is a forecast multiple, not a restatement of trailing P/E. |
| Return on equity | Net income $120m ÷ average equity ($900m + $1,100m) ÷ 2 = 12%. Using ending equity alone produces 10.9%. | Average-balance method, attributable income, common versus total equity, fiscal duration, restatements, and currency consistency. |
| EV / EBITDA | Market cap $2.0b + debt $0.5b - cash $0.2b = EV $2.3b; EV ÷ TTM EBITDA $0.23b = 10×. | Market timestamp, debt scope, leases, preferred stock, minority interest, restricted cash, EBITDA adjustments, acquisition timing, and currency conversion. |
Do not force every formula to return a number. Negative trailing earnings normally make P/E economically not meaningful; zero or negative common equity can invalidate ROE and debt-to-equity; negative EBITDA can make an EV/EBITDA ranking misleading; and current ratio is not a general liquidity test for a bank. Return null with a typed reason such as negative_denominator, zero_denominator, sector_not_applicable, or source_missing. These states are different and should not be replaced by zero or an extreme sentinel value.
How to evaluate a free financial ratios API
| Criterion | What to inspect | How to test | Main risk |
|---|---|---|---|
| Coverage | Symbols, exchanges, sectors, ratio families, and history. | Query a representative watchlist. | Inactive and foreign listings. |
| Methodology | Formula, period, adjustments, currency, and restatements. | Cross-provider validation. | Silent formula differences. |
| Lineage | Source filing, accession, fiscal period, price timestamp, and calculation version. | Trace one ratio back to its numerator and denominator. | A plausible value that cannot be audited. |
| Edge cases | Negative earnings, zero equity, banks, recent IPOs, currency changes, and amended filings. | Build a fixed exception test set. | Invalid ratios presented as ordinary numbers. |
| Free plan | Calls per minute and day, batch size, and retention. | Simulate scheduled prototype traffic. | Burst limits and attribution rules. |
| Operations | Timestamps, errors, status, versioning, and support. | Retry errors and monitor updates. | Undocumented breaking changes. |
| Usage rights | Internal analysis, display, caching, redistribution, attribution, and AI-output terms. | Map the license to the planned product flow. | A technically accessible field that cannot be shipped. |
A practical financial ratios API integration
Write down whether the ratio will support a watchlist, a peer comparison, a valuation screen, an AI research brief, or a customer-facing feature. The decision determines the required universe, update speed, history, evidence, and license.
Use QVeris Tool Finder to identify candidates, then inspect authentication, endpoint schemas, quotas, licensing, calculation notes, and example responses before issuing production requests.
Include a loss-making company, a bank, a foreign issuer, a recent listing, a fiscal-year changer, and a company with a restatement. Missing or nonsensical ratios reveal more than a perfect mega-cap example.
Store provider values beside raw statement components. Normalize fiscal period, currency, units, security identifiers, and null conventions before ranking companies. Keep the response timestamp, formula version, and source filing so a result can be reproduced later.
Recalculate a small set of critical ratios and compare them with the provider response. Establish tolerances for rounding and timing differences, flag unexplained deviations, and rerun the same tests when the provider changes a schema or methodology.
Use QVeris to find and verify ratio APIs
QVeris gives applications and agents a consistent path to discover financial-data tools, inspect their capabilities, and call an appropriate API. That is useful when one workflow needs to compare several providers without hard-coding a different discovery process for each one. QVeris reduces integration guesswork; it does not make unlike ratios comparable automatically. Your application still owns the accepted formula, fiscal-period policy, null handling, entitlement checks, and evidence shown to the end user.
FAQ
Yes. Free plans often include common ratios, but limits, exchange coverage, reporting periods, and permitted uses vary.
For important research, keep raw components and reproduce critical formulas. Provider-calculated values are convenient, not automatically comparable.
They may use different price timestamps, diluted or basic earnings, trailing periods, adjusted earnings, or treatment of negative EPS. Compare the numerator, denominator, and as-of time before deciding that either value is wrong.
Prefer a null value plus a reason code such as negative earnings or zero equity. A zero, extreme sentinel, or unexplained negative number can corrupt screens and AI summaries.
Statement-based ratios should update after new filings and restatements. Price-based ratios may change intraday or at end of day. The response should expose both the filing period and market-data timestamp.
Only with care. Capital structure, accounting rules, and operating models differ. Use sector-aware peer groups and avoid applying industrial-company liquidity or leverage thresholds to banks and insurers.