
Free ETF Screener API
Data, Filters & Examples
Compare free-tier ETF APIs by filters, holdings, expense ratios, coverage, rate limits, and licensing—then test a documented request.
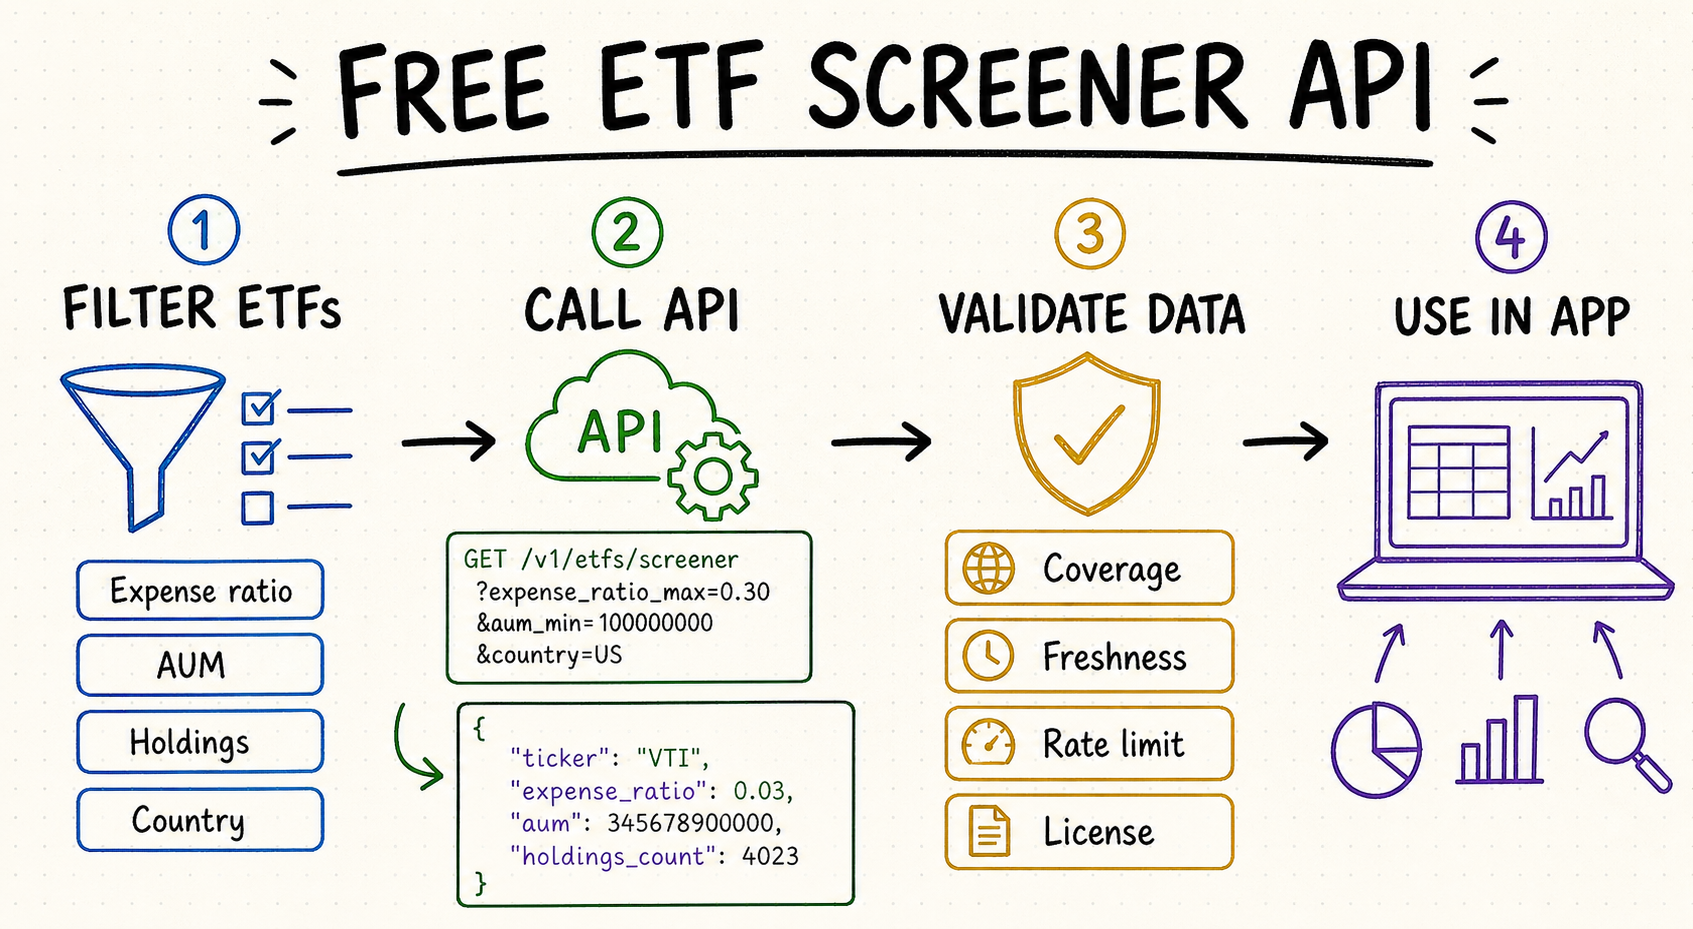
Free ETF screener API: what developers need
The practical task is to submit structured filters and receive a usable ETF universe in JSON: symbols, names, exchanges, expense ratios, assets under management, holdings, prices, and update timestamps. Developers then need to verify that the endpoint—not merely a web screener—supports the same fields, operators, pagination, free limits, and license their application requires.
An ETF screen is not a stock screen with a different security label. The decision unit is a portfolio wrapper: developers need mandate and benchmark, asset class, geography, currency exposure, replication method, leverage or inverse status, share class, expense ratio, assets, trading liquidity, NAV behavior, holdings overlap, and portfolio as-of dates. Price performance alone cannot explain what the fund owns or how closely it delivers the intended exposure.
Important: “Free” may mean a trial, a limited daily quota, delayed data, non-commercial use, or only selected endpoints. Verify the live plan and license before production use.
ETF data API fields and filters to compare
Expense ratio, AUM, asset class, and geography
A useful REST API to filter ETFs should expose documented operators, units, currencies, enums, sorting, and pagination for the fields that define the investable universe.
ETF holdings API and portfolio fields
Check whether holdings include ticker, name, weight, shares, sector, country, and an as-of date. Holdings coverage and refresh cadence often differ from quote coverage.
Price, volume, yield, returns, and freshness
Confirm whether data is real-time, delayed, or end-of-day; identify the timestamp and currency; and avoid comparing metrics calculated over different periods.
Authentication, rate limits, and commercial license
Record requests per minute and day, pagination cost, retry rules, permitted storage, attribution, redistribution, and whether the free tier can support a public application.
NAV, premium or discount, and tracking behavior
Preserve market price, NAV, NAV date, premium or discount, benchmark identifier, total-return period, and tracking-difference methodology. Do not compare an intraday price with a prior-day NAV as if both were synchronized observations.
Fund structure and exposure flags
Distinguish physical from synthetic replication, distributing from accumulating share classes, hedged from unhedged exposure, and ordinary from leveraged, inverse, active, commodity, or note-like products. Similar names can conceal materially different behavior.
Holdings overlap and concentration
Use stable holding identifiers, normalized weights, cash and derivative treatment, top-ten concentration, and portfolio date to calculate overlap. Summing displayed ticker weights alone can miss derivatives, duplicate share classes, and look-through exposure.
Start with unleveraged, non-inverse equity ETFs whose mandate covers a broad domestic market; expense ratio no higher than 0.20%; AUM at least $100 million; 30-day median dollar volume at least $2 million; median quoted spread no wider than 0.20%; at least 100 disclosed holdings; and a portfolio date no older than the accepted tolerance. Sort by expense ratio, then spread, then a stable fund ID. Return every failed rule and missing field beside each excluded fund. A low expense ratio cannot compensate for the wrong mandate, stale holdings, or an unsupported share class.
Volume alone is incomplete. Keep spread, quoted depth, time of day, underlying-basket liquidity, creation-unit mechanics, premium or discount, and data timestamp.
Low AUM may justify review, not automatic rejection. Combine launch age, asset and flow trend, trading activity, issuer support, fund status, liquidation notices, and the date each signal became known.
Free ETF API sources to evaluate
These current pages document ETF search or screening capabilities. The table is a verification shortlist, not an endorsement; plans, fields, and terms can change. Test every candidate with the same small universe: one broad index ETF, one bond ETF, one international fund, one leveraged or inverse product, one accumulating or hedged share class, and one recently launched fund. Compare identifier mapping, expense-ratio units, holdings dates, NAV fields, asset currency, pagination, and exclusion reasons.
| Source | Useful signal | Verify before use |
|---|---|---|
| InsightSentry | Documents an ETF screener endpoint with exchanges, countries, fields, sorting, and pagination. | Current free quota, ETF-specific fields, delay, and commercial terms. |
| API Ninjas | Documents ETF detail, list, and search filters for holdings, AUM, expense ratio, and country. | Which endpoints remain free, delayed pricing, page caps, and license. |
| Data Captain | Advertises a no-card free tier with ETF lists and batch prices plus paid screener features. | Exact free endpoints, daily quota, coverage, history, and production rights. |
| FactSet Funds API | Provides a criteria-based fund and ETF screener with reference data and holdings. | Entitlement and pricing; do not assume this enterprise API is free. |
ETF screener API Python example and checks
1. Discover supported ETF fields
Call the provider’s metadata or options endpoint first. Use only documented field IDs and enum values instead of guessing parameter names.
2. Send a narrow screener request
A typical Python call is requests.post(url, json={"fields":["close","volume"],"exchanges":["NYSE","NASDAQ"],"sortBy":"volume"}, headers={"Authorization":f"Bearer {api_key}"}, timeout=20). Adapt the body to the selected provider’s documentation.
3. Validate schema, units, and timestamps
Use raise_for_status(), then check ticker uniqueness, numeric types, currencies, expense-ratio units, holdings dates, pagination, and delayed-data markers.
4. Design for quotas and licensing
Cache stable metadata, back off on 429 responses, log retrieval time and provider, and keep commercial-use and redistribution terms with the integration.
5. Normalize share classes and identifiers
Keep exchange ticker, listing currency, fund or share-class identifier, domicile, and benchmark ID separate. Decide whether multiple listings or currency-hedged classes belong in the same comparison set, and never merge solely by fund name.
6. Reconcile holdings before computing overlap
Check that weights share the same portfolio date and sum within an explained tolerance. Map securities by stable IDs, preserve cash and derivatives, and label direct versus look-through exposure before calculating concentration or similarity.
7. Validate the final shortlist against the mandate
For each result, show which rules passed, which data dates were used, and whether any required field was missing. Read the issuer’s current fund documents to confirm objective, benchmark, leverage, distributions, and material structural risks.
How QVeris helps connect ETF data capabilities
QVeris does not create ETF market data, grant data licenses, recommend funds, or guarantee a provider. It helps developers and agents discover available capabilities, inspect interfaces, and connect a selected external tool through a consistent workflow.
- Open the QVeris provider details for ETF reference, holdings, NAV, quote, and benchmark capabilities.
- Inspect inputs, outputs, authentication, provider documentation, supported identifiers, portfolio dates, units, and entitlement notes before connecting.
- Pass asset class, geography, structure exclusions, expense and size limits, liquidity rule, holdings date tolerance, and desired evidence as explicit requirements.
- Keep provider, effective date, retrieval time, raw identifiers, and license notes with each result; QVeris connectivity is not investment advice.
Free ETF screener API FAQ
Is there a free API for ETF data?
Yes. Some providers offer free tiers for ETF lists, delayed prices, details, or screening. Coverage, quota, fields, and commercial rights vary.
How do I screen ETFs with an API?
Discover supported fields, send documented filters such as expense ratio, AUM, holdings, country, or exchange, then validate pagination, units, and timestamps.
Which ETF API includes holdings and expense ratios?
API Ninjas documents both fields, while other providers split screening, details, and holdings across endpoints. Verify current plan access before choosing.
Can I use a free ETF API commercially?
Only if the current license permits it. A free key does not automatically grant storage, redistribution, display, or production rights.
Does QVeris provide ETF market data?
No. QVeris helps discover and connect external capabilities; the selected provider remains responsible for data coverage, quality, and licensing.
What is the difference between ETF liquidity and trading volume?
Exchange volume and spread describe secondary-market trading, while creation and redemption capacity also depends on the underlying basket and authorized participants. Use volume, spread, assets, depth, and underlying exposure together.
How do I compare ETF holdings overlap?
Align portfolio dates, map holdings with stable identifiers, normalize weights, and decide how to treat cash, derivatives, and look-through positions. Name or ticker matching alone can overstate or understate similarity.
Why can ETF price and NAV differ?
They may have different timestamps, and market supply, demand, spreads, closed underlying markets, or stressed conditions can create a premium or discount. Store both observations and their effective times.