
Free ETF Flows API
Data, Fields & Integration
Use a free ETF flows API to retrieve daily fund inflows and outflows, then verify coverage, freshness, fields, and limits before integration.
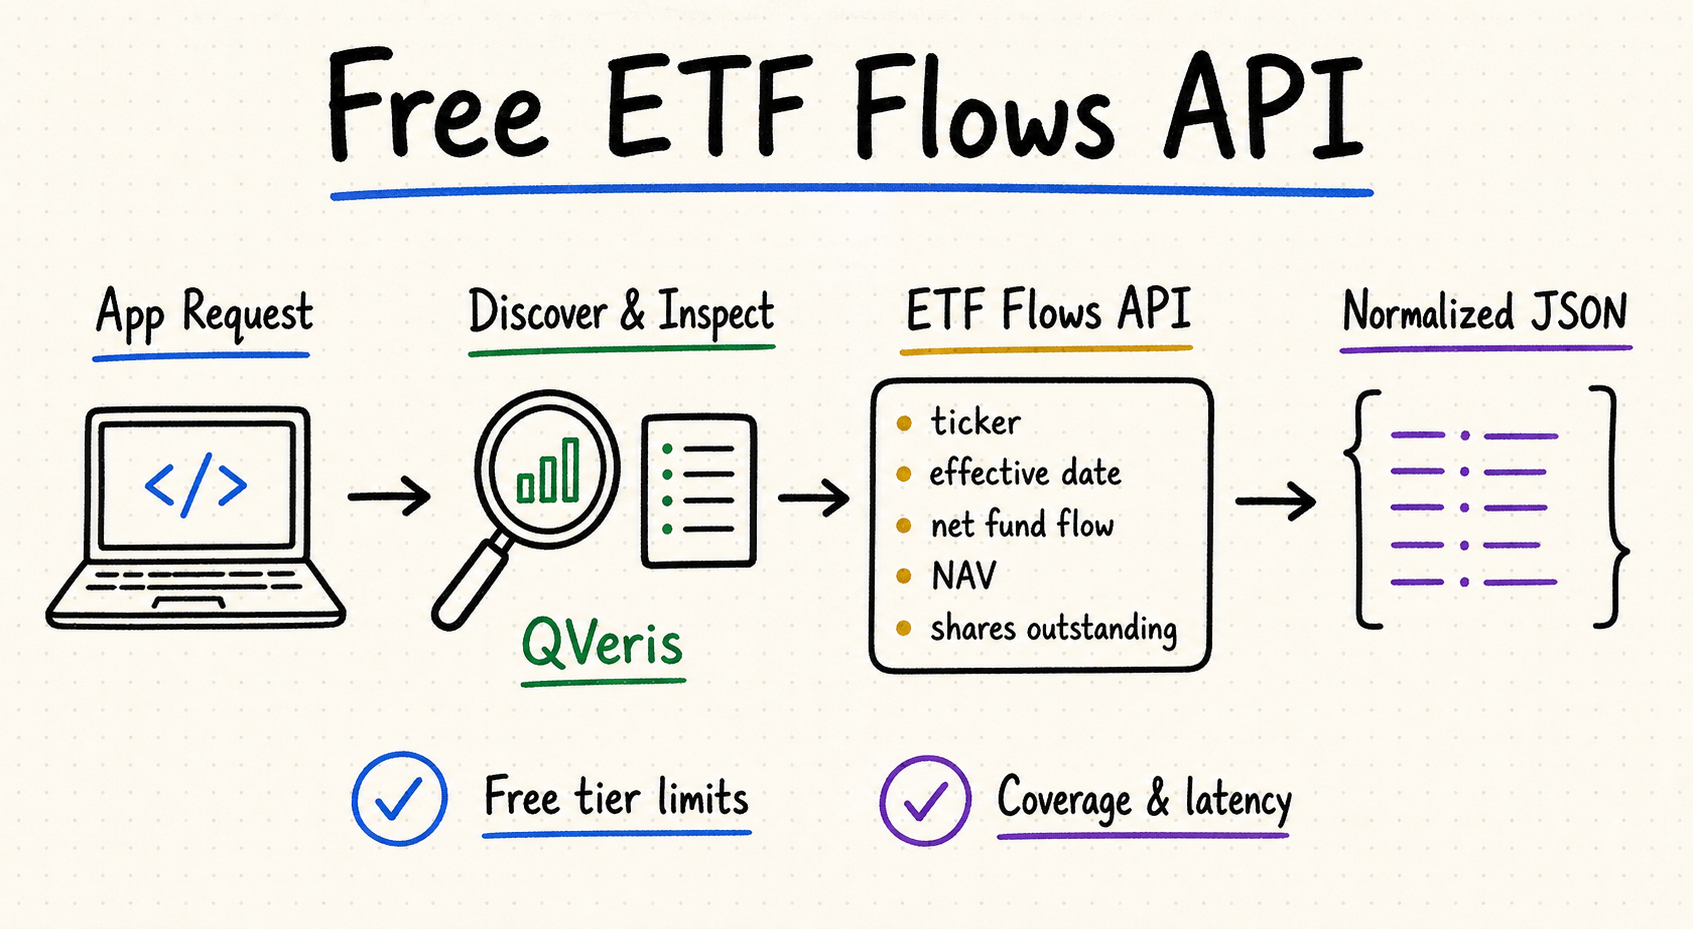
Free ETF flows API: what to expect
Retrieve daily or historical creations and redemptions for the correct fund and share class, with the dates and inputs needed to explain each flow.
Expect stable fund ID, effective and publication dates, shares created or redeemed, shares outstanding, NAV, net flow, currency, methodology, and revision.
Confirm request quotas, delayed data, history depth, coverage, attribution, and commercial-use rights before production use.
ETF flows reflect primary-market share creation and redemption. They are not secondary-market turnover, investor buy-versus-sell volume, performance-driven AUM change, or a holdings-change feed.
What ETF fund flow data actually measures
ETF fund flows estimate capital entering or leaving a fund through share creation and redemption. A positive value generally indicates inflow; a negative value indicates outflow. The effective date matters because a provider may process or publish the observation later.
Some datasets report issuer-supplied flow; others estimate it from the change in shares outstanding multiplied by NAV or another price. That estimate must define whether the share change is adjusted for splits, which day's NAV is used, how currency is converted, and how a missing or revised share count is handled. Two providers can disagree without either using a simple arithmetic error.
Daily ETF inflows and outflows versus trading volume
Trading volume counts secondary-market shares changing hands. It can be high even when fund shares outstanding do not change. For a daily ETF fund flows API, inspect whether the value is directly supplied, calculated from shares outstanding and NAV, or revised after issuer files arrive.
Historical ETF flow data and revision handling
Store both effective and processed dates when available. This avoids look-ahead bias in backtests and makes delayed issuer reporting visible. Also record currency and unit metadata rather than assuming every response is in U.S. dollars.
Fund flow versus change in AUM
AUM can rise because the portfolio appreciated even when no new shares were created, and it can fall because of market losses without a redemption. To isolate flow, use share changes and a documented valuation basis, then keep performance, distributions, FX, and flow as separate explanatory components.
An ETF moves from 10 million to 11 million shares outstanding. Using the prior NAV of $24.00 produces an estimated inflow of $24 million; using the current NAV of $25.20 produces $25.2 million. Both calculations use the same one-million-share creation but differ by $1.2 million because the valuation point differs. The response should therefore expose the share-count dates, NAV date, chosen formula, currency, and whether the value is issuer-reported or vendor-estimated.
Check whether ending AUM can be explained by beginning AUM, net creations or redemptions, portfolio return, distributions, FX translation, fees, and known revisions. Treat the remaining difference as an unresolved residual.
If shares double because of a 2-for-1 split while economic units stay unchanged, a raw share-count difference must not become an inflow. Apply the split factor before measuring creations.
Zero flow means the source reports no net creation or redemption. A missing share snapshot, late issuer file, unsupported fund, or failed calculation must remain unknown.
How to evaluate a free ETF flow data API
| Check | What to verify | Why it matters |
|---|---|---|
| Coverage | Markets, active and delisted funds, asset classes, ticker history. | Prevents silent gaps in comparisons and backtests. |
| Freshness | Effective date, processed date, delay, revision policy. | A “daily” endpoint may still publish delayed observations. |
| Fields | Net flow, NAV, shares outstanding, currency, units, identifiers. | Supports validation and provider switching. |
| Free limits | Quota, history depth, attribution, caching, commercial use. | A trial is not always a durable free tier. |
| Operations | Authentication, pagination, errors, rate-limit headers, support. | Determines production reliability and maintenance effort. |
| Methodology | Direct or estimated flow, share-change rule, NAV date, split and FX handling. | Makes provider differences explainable. |
| Identity | Fund, share class, listing, stable ID, ticker history, mergers. | Prevents double counting and broken histories. |
| Revisions | First publication, processed time, version, correction reason. | Supports point-in-time research and audit. |
Integrate historical and daily ETF flows data
Step 1: inspect an ETF fund flows endpoint
Read the provider schema before coding. Confirm required ticker and date filters, pagination, whether zero and null have different meanings, and whether the endpoint exposes processed date separately from effective date.
Step 2: normalize the response
Map provider fields into a stable internal model such as ticker, effective_date, processed_date, net_flow, currency, nav, and shares_outstanding. Preserve the raw response for audit and troubleshooting.
Step 3: validate before production use
Test several liquid and less-liquid tickers across inflow, outflow, zero, missing, and revised days. Log rate-limit responses, cache according to license terms, and alert on unexpected schema or unit changes.
Step 4: independently rebuild estimated flows
Where the methodology permits, calculate the change in adjusted shares and multiply by the documented NAV basis. Compare signs, dates, currency, and rounding; do not force agreement when the provider uses direct creation-unit data or later corrections.
Step 5: aggregate without mixing data availability
Build weekly or monthly totals from daily effective dates, but carry publication and revision times. A period total used in a backtest must include only observations available by the simulated decision time.
Step 6: monitor identity and continuity
Flag unexplained sign reversals, duplicated dates, missing business days, large flows without share-count changes, ticker changes, fund mergers, liquidations, and currency switches. Preserve raw and revised versions instead of overwriting history.
Use QVeris to find and call ETF data capabilities
QVeris helps developers and agents discover, inspect, and call available financial-data capabilities. Use the QVeris provider details to assess relevant providers, then inspect inputs and outputs before wiring a capability into your application.
- Search for ETF fund-flow capabilities instead of assuming a general market-data API includes flows.
- Inspect fund identity, direct-versus-estimated methodology, share and NAV dates, units, revision model, required parameters, fields, and limits before calling.
- Require effective and publication date ranges, currency, aggregation window, revision policy, and raw calculation inputs in the tool request.
- Keep provider-specific methodology behind a normalized, revision-aware application interface so it can be audited or replaced.
FAQ
Some providers advertise free access, free plans, trials, or free datasets. Verify current quotas, history, licensing, and whether fund-flow endpoints are included rather than only ETF profiles or prices.
Useful responses include ticker, effective date, processed date, net fund flow, NAV, shares outstanding, currency, units, and source or revision metadata.
Flows are commonly derived from changes in shares outstanding multiplied by an appropriate NAV measure, though vendor methodology and revision handling differ.
Many specialist endpoints support ticker and date filters, but history depth, delisted-fund coverage, corrections, and pagination vary by provider.
No. Volume measures secondary-market trading; fund flow reflects primary-market creations and redemptions that change shares outstanding.
No. QVeris can help discover and inspect available capabilities, but provider availability, pricing, limits, and licensing remain provider-controlled and can change.
No. AUM also changes with portfolio returns, distributions, and FX. Flow is tied to creation or redemption of shares and should be separated from performance-driven asset changes.
They may use direct issuer records or estimates, different share-count snapshots, NAV dates, split adjustments, FX, publication cutoffs, and revisions. Compare methodology and raw inputs before judging the result.
Not necessarily. Creations can support inventory, hedging, arbitrage, or allocation changes, and flow says nothing by itself about future return. Interpret it with mandate, market context, price, volume, and holdings.