
Free Company Peer Data API for Comps
Build defensible peer groups with consistent identifiers, periods, currencies, financial metrics, and documented selection rules.
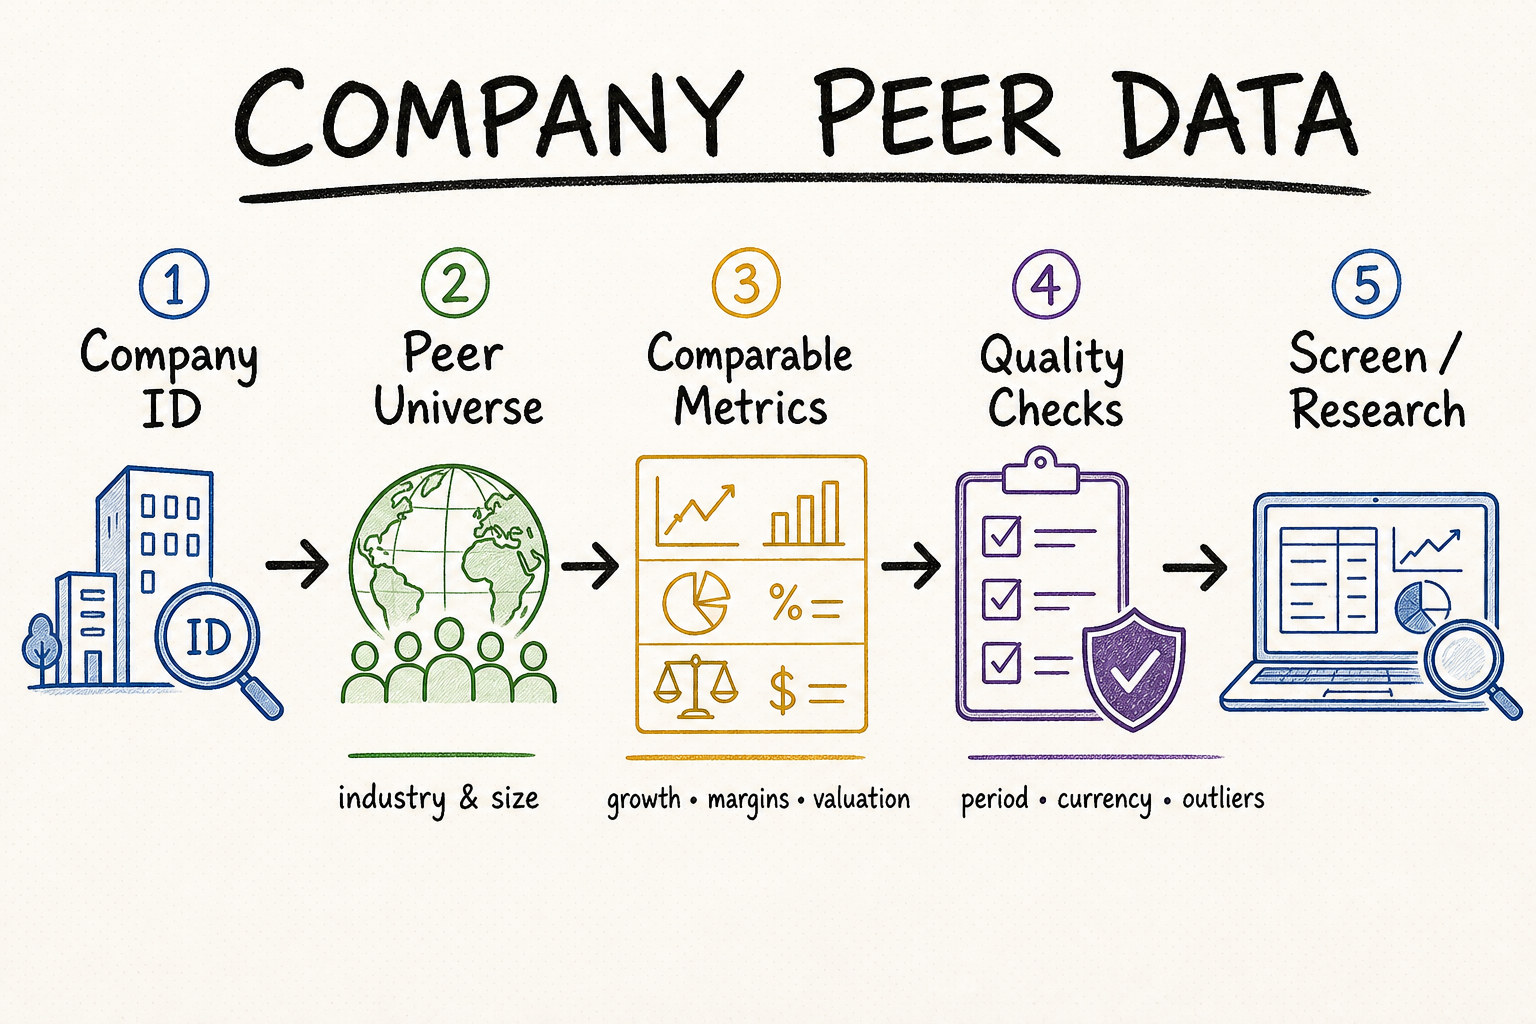
What a company peer data API should do
A useful response identifies why each company belongs: industry, business model, geography, revenue scale, market value, growth, or another declared rule.
Metrics should share fiscal definitions or expose period dates clearly. Mixing annual, trailing, and quarterly values can create false rankings.
Keep currency, units, statement basis, timestamps, provider, and company identifiers so every comparison can be reproduced.
A good peer API should return candidates, not an unexplained verdict. The application needs enough evidence to include or exclude each company for a specific use case: valuation, operating benchmarking, credit analysis, or market positioning. A software issuer may share an industry code with hardware, consulting, or marketplace businesses but differ materially in revenue model and margin structure. Treat the provider’s list as a documented starting universe, then apply a reproducible selection policy.
Fields that make peer data usable
A peer API may return a ready-made list, similarity scores, or attributes for building a peer set. Request permanent company and listing IDs, name, industry code, country, reporting currency, fiscal year end, and active status. Symbols alone are fragile: they change, collide across exchanges, and may identify a security rather than the company.
Common metrics include revenue, growth, margins, EBITDA, debt, market value, and valuation multiples. Require period end, units, currency method, and whether each value is reported, normalized, or estimated.
Keep a permanent company ID separate from listing, share-class, ADR, and ticker IDs. Record the primary listing, active dates, parent or subsidiary relationship, and whether market value represents one security or the consolidated company.
Return the taxonomy and version, business description or segment exposure, geography, scale bands, similarity features, score, rank, filters, and exclusion reason. This makes a peer set explainable rather than provider-dependent.
Attach period start and end, fiscal year, annual or interim form, trailing-window definition, accounting basis, restatement status, currency, unit, and source date to every metric used in ranking.
For P/E, EV/EBITDA, price-to-sales, or free-cash-flow yield, retain numerator and denominator as well as the multiple. Specify market-value time, net-debt policy, diluted share basis, treatment of negative denominators, and foreign-exchange time.
Save an as-of time, methodology version, contributor source, and membership effective dates. Historical analysis should use the peers and information available then, not a present-day list retroactively applied to the past.
{
  "subject_company_id": "company_1024",
  "peer_company_id": "company_2048",
  "peer_set_as_of": "2026-07-31",
  "methodology_version": "peer-model-3.2",
  "membership": "included",
  "similarity_score": "0.84",
  "features": {
    "business_model": "subscription-software",
    "revenue_scale_band": "500m-1b",
    "primary_region": "north-america"
  },
  "metric_period_end": "2026-06-30",
  "metric_basis": "TTM",
  "reporting_currency": "USD",
  "source_observed_at": "2026-08-01T09:15:00Z"
}
This normalized example separates three clocks: when peer membership was valid, which financial period supports the comparison, and when the source was retrieved. It also keeps the decision and feature evidence together. If the provider returns only a list of tickers, enrich it through an identity and fundamentals layer before calculating medians or multiples. Never infer an exclusion from a missing row; record whether the candidate was screened out, unsupported, inactive, or temporarily unavailable.
Evaluate a free company peer data API
| Check | What to verify | Failure signal |
|---|---|---|
| Selection | Taxonomy, filters, ranking, and exclusions | Opaque or unstable peers |
| Coverage | Regions, exchanges, private firms, inactive listings | Biased comparison universe |
| Timing | Period ends, update lag, restatements | Mixed or stale observations |
| Identity | Company, listing, share class, ADR, parent, and active dates | Duplicates or incomparable securities |
| Methodology | Feature weights, score meaning, taxonomy version, and exclusions | A peer list that cannot be defended |
| Metric lineage | Numerators, denominators, currency, period, source, and estimate status | False ranking from mixed definitions |
| Access | Quota, pagination, caching, display rights | Prototype cannot scale legally |
Test a bank, new listing, foreign issuer, and multi-class company. Repeat calls to detect peer-list drift. Free access does not automatically permit redistribution, client display, model training, or commercial use.
A worked case exposes problems that a field checklist cannot. Assume the subject is a listed cloud billing software company with subscription revenue, mid-market customers, positive gross margin, negative operating margin, and most revenue in North America. An industry-code match can produce many candidates, but the final peer set should reflect the decision being made.
| Candidate profile | Operating benchmark | Valuation peer set | Reason |
|---|---|---|---|
| Subscription billing SaaS, similar size | Include | Include | Revenue model, customer motion, margin structure, and lifecycle are aligned. |
| Large enterprise SaaS platform | Use cautiously | Sensitivity only | Business model matches, but scale, sales efficiency, liquidity, and profitability can dominate the multiple. |
| IT consulting company with the same code | Exclude | Exclude | Labor-led project revenue and gross-margin economics are not comparable with subscription software. |
| Payments marketplace with recurring fees | Exclude or segment | Secondary reference | Recurring revenue alone does not resolve take-rate, transaction-volume, credit, and regulatory differences. |
| Similar SaaS issuer in another region | Include with region tag | Include after FX and market checks | Operating similarity may be strong, but reporting currency, market regime, accounting basis, and liquidity require normalization. |
Start with hard eligibility rules—active listing, required geography, available periods, supported accounting fields, and no duplicate company identity. Rank the surviving candidates using declared features such as business-model match, revenue scale, growth, margin profile, customer exposure, and lifecycle. Hard filters prevent invalid comparisons; the score orders candidates that are already eligible.
A sample model might assign 35% to business-model match, 20% to product or industry exposure, 15% to logarithmic revenue distance, 15% to growth and margin profile, 10% to geography, and 5% to lifecycle. Those weights are not universal. Return every component, missing-value treatment, final score, and methodology version so an analyst can see why one candidate outranked another.
Calculate the median and range, then repeat after removing the largest company, the highest multiple, and each member one at a time. Show the number of valid observations for every metric. If the valuation conclusion changes materially after one exclusion, report a sensitivity range rather than presenting one precise peer median.
Build a reliable peer comparison pipeline
- Define the decision first: state whether the peer set supports valuation, operating benchmarks, credit, market positioning, or another decision because each purpose needs different filters.
- Resolve identity first: map user input to permanent company, listing, and security IDs before requesting peers; collapse duplicate share classes only under an explicit rule.
- Store the selection recipe: retain filters, feature values, weights, taxonomy version, similarity score, rank, exclusions, request time, and raw provider response.
- Normalize before ranking: align periods, currencies, units, accounting basis, signs, and null rules; winsorize or impute only under a documented policy.
- Separate discovery from metrics: version peer membership independently from fast-changing market values and slower financial statements so each dataset can refresh safely.
- Review outliers manually: inspect conglomerates, banks, pre-revenue issuers, recent listings, negative denominators, M&A targets, and companies undergoing major business-model changes.
- Monitor drift: alert when coverage falls, peer membership changes unexpectedly, one company dominates the median, fields disappear, or update lag exceeds policy.
Use QVeris to discover peer data capabilities
QVeris helps applications and AI agents discover external data tools, inspect their inputs and outputs, and route a request to an appropriate capability. Use it to shortlist providers and reduce integration guesswork, then keep peer methodology, licensing, and quality controls inside your own workflow.
FAQ
Comparable companies plus the identifiers, metrics, periods, and rules needed to explain the comparison.
Possibly, when coverage, quota, uptime, licensing, and support fit the workload. Add monitoring and a fallback.
No. Business model, geography, size, growth, profitability, and lifecycle can improve comparability.
There is no universal count. Use enough independent observations for the statistic, but not so many that business-model differences overwhelm comparability. Show the full distribution and sensitivity to exclusions.
Usually not for operating comparisons because they represent one company. For security-level market analysis they may matter. Preserve both IDs and document the consolidation rule.
Do not rank or average them as ordinary positive multiples. Mark the denominator and sign, use an alternative metric where appropriate, and disclose exclusions from summary statistics.
Only when membership, identifiers, taxonomy, financial values, and market values are preserved point in time. Applying today’s surviving peer list to the past creates look-ahead and survivorship bias.